How To Guide
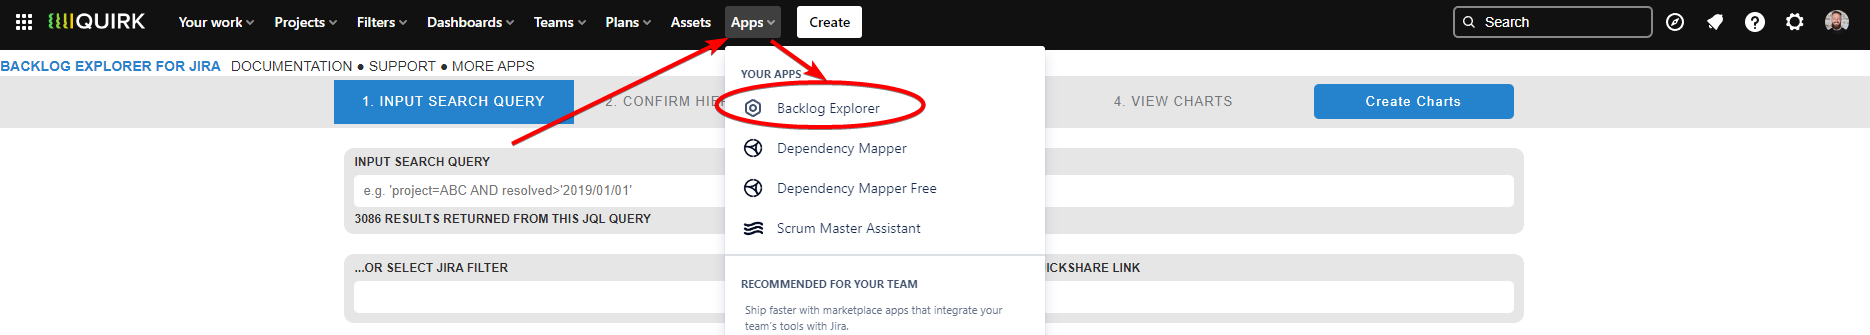
How to find the Backlog Explorer app
Navigate to the Backlog Explorer app through the top navigation bar of Jira
Apps > Backlog Explorer
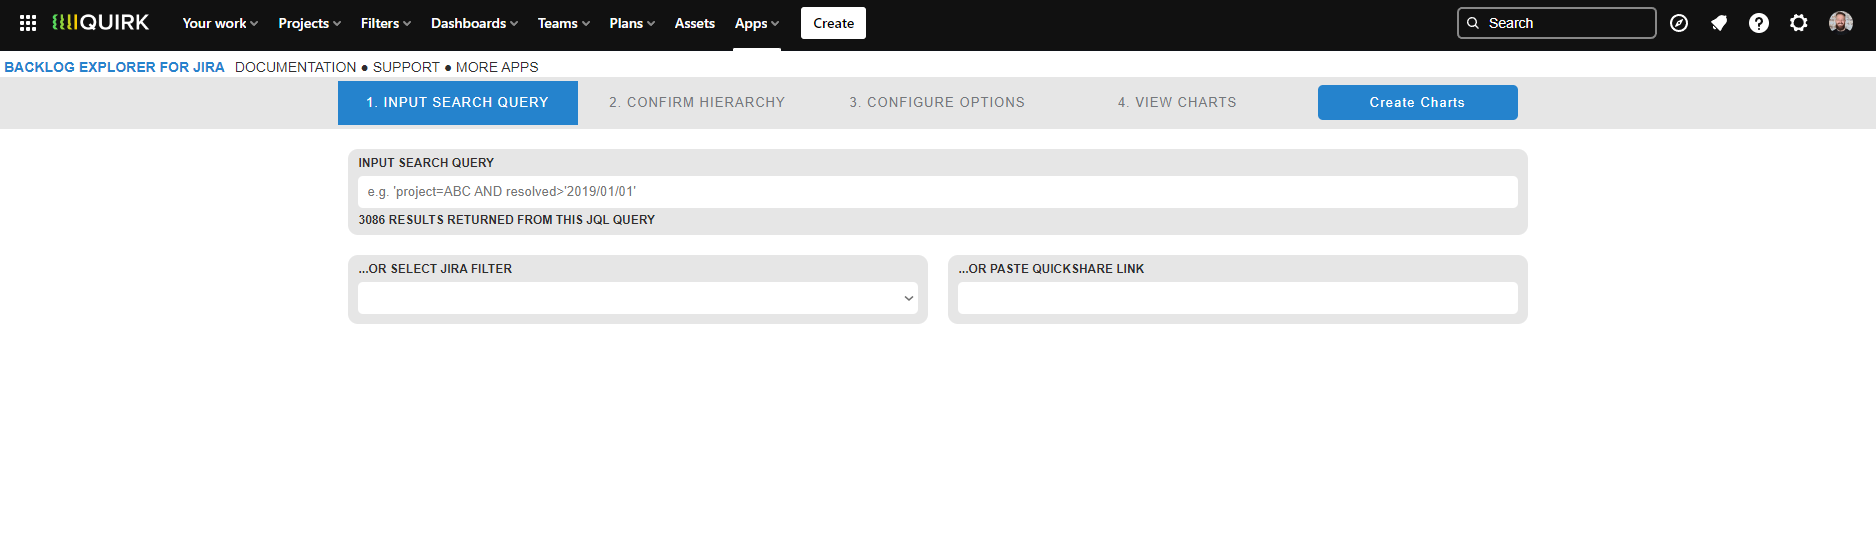
Input Search Query
Input JQL Query
The JQL Query is what governs the scope of the end visualisation, and as such is important to ensure you only query relevant tickets that you want included in the end result.
e.g. If you wanted to look for all stories in the ABC project that were resolved before 2019, your initial JQL query would be |
|---|
Or Select Jira Filter
Alternatively, select one of your existing Jira filters that you’ve saved using the dropdown and it will auto-populate the JQL Query field.
After you’ve input your query, a notification will tell you how many results were found (e.g. 125 results).
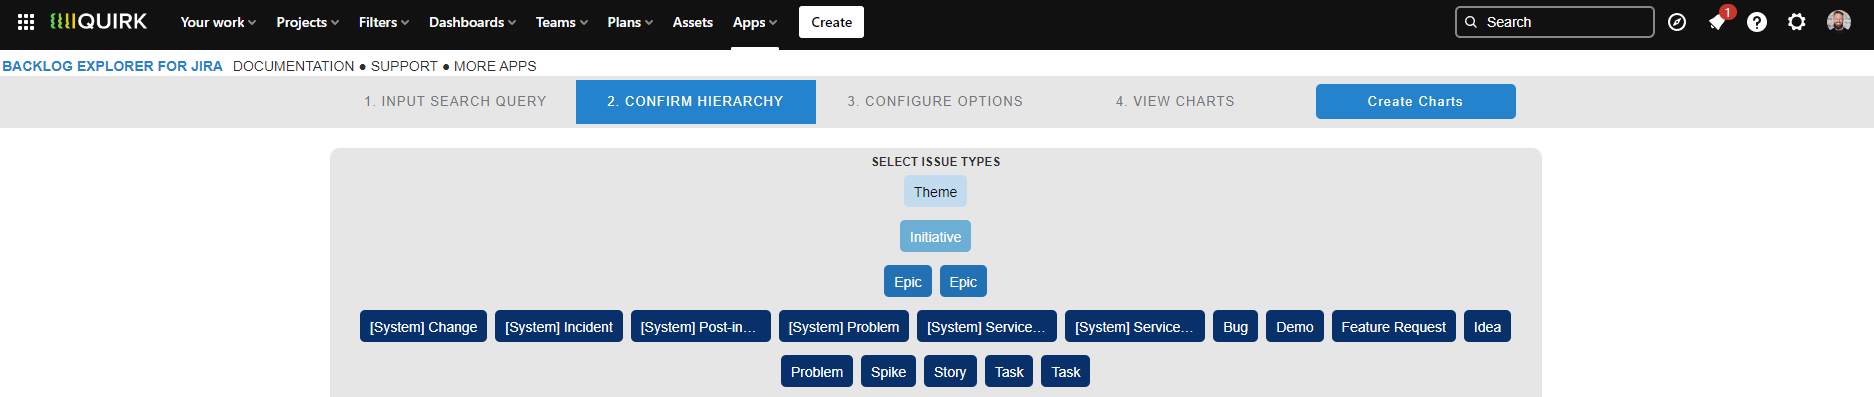
Confirm Hierarchy
In this tab we have a reference point for how each issue type is structured within the issue hierarchy of your instance. Each layer will be coloured differently to distinguish the level they sit on.
Configure Options
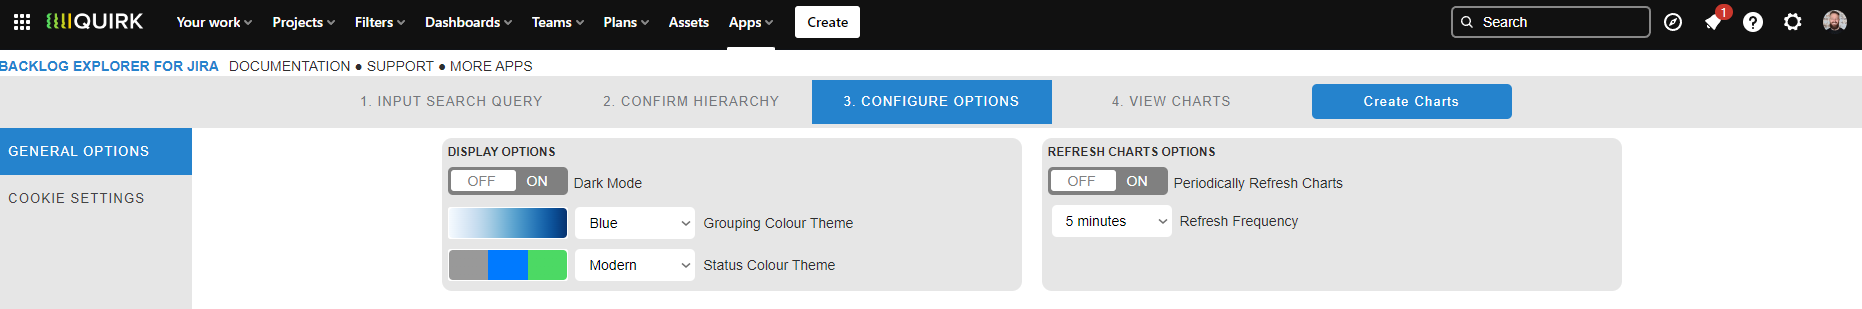
Display Options
Dark Mode - Toggles the Dark Mode or Light Mode themes of the app
Grouping Colour Theme - Determines the colour themes for each charts
Status Colour Theme - Determines how status categories are coloured (To Do, In Progress & Done), which can be either the Modern theme (Grey, Blue, Green) or Classic (Blue, Yellow, Green) respectively
Periodically Refresh Data - When enabled, a full refresh of the data will be performed in the background after the initial charts are generated
Refresh Frequency - Determines how often the data is refreshed
Note: Be mindful that each refresh involves making several API calls, so ensure the refresh frequency is ‘sensible’! |
|---|
Cookie Settings
Show Cookie Settings Dialog - Displays the Cookie Settings modal, allowing you to choose what information is captured by the tool (see our Privacy Policy for more information)
View Chart - Backlog Wheel
This view can be seen after clicking the ‘Get Data’ button and navigating to Backlog Wheel on the left side menu.
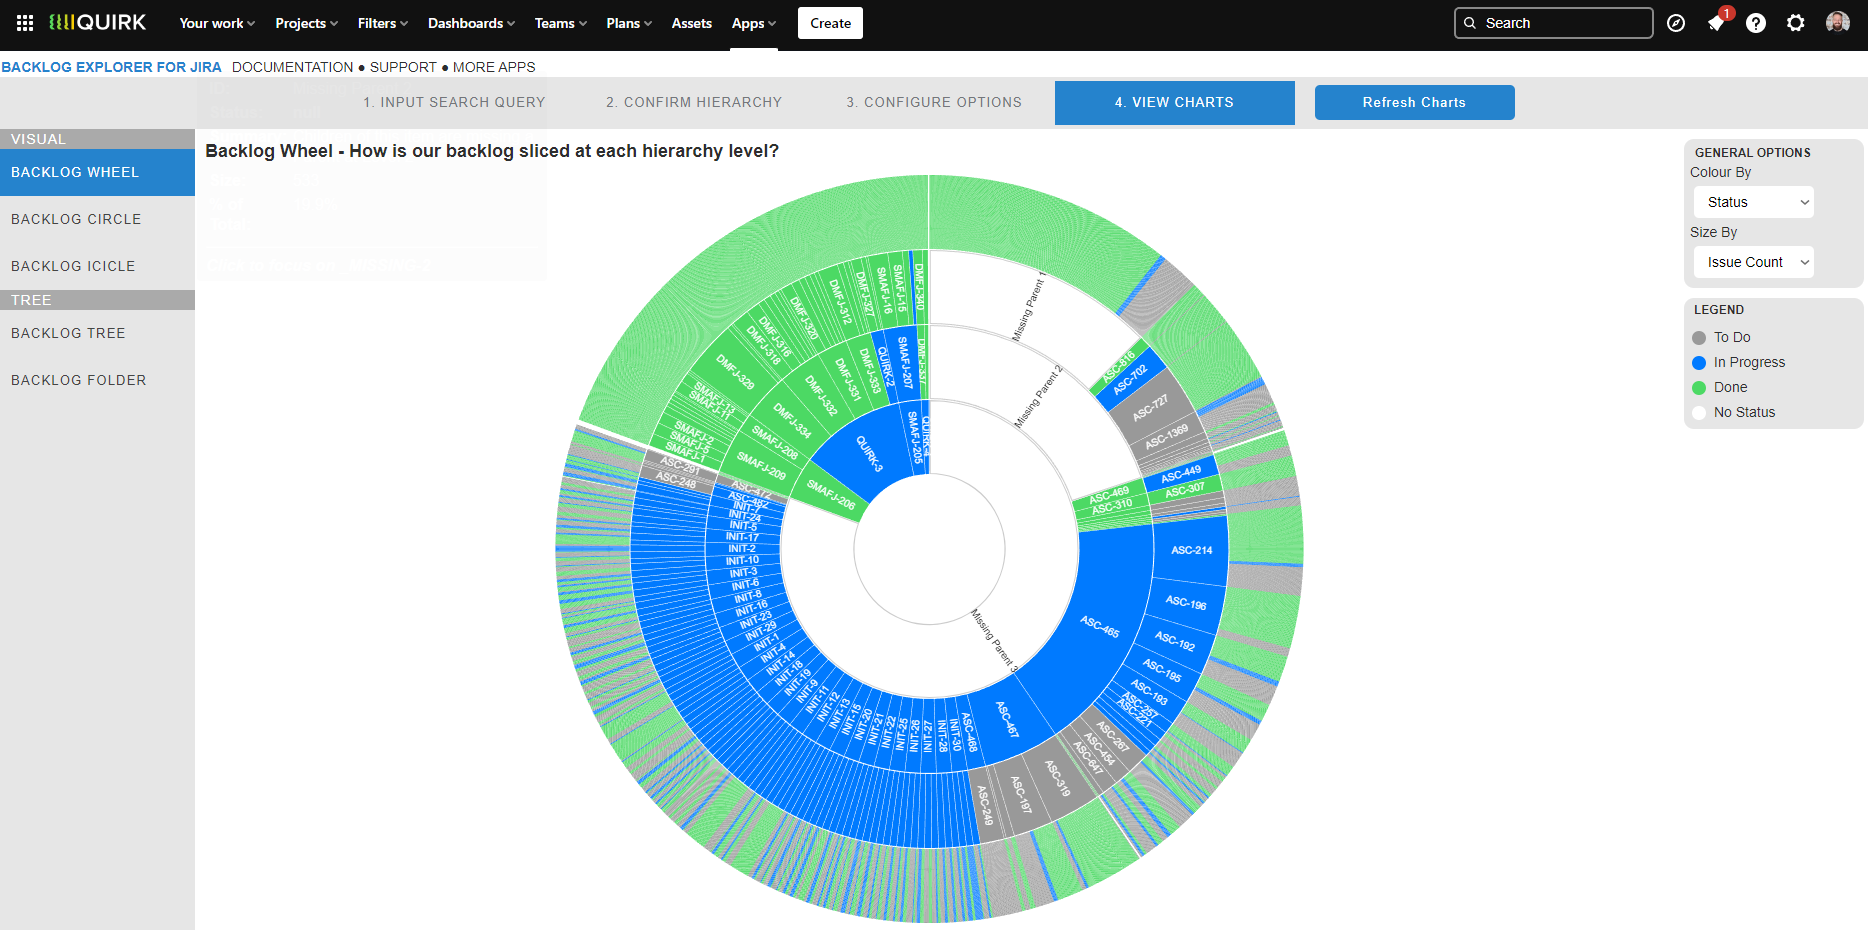
The Backlog Wheel is a representation of every issue, and their returned parents, wrapped around 360°. The lowest layer of issue types (e.g. Stories and Tasks) sit on the outermost ring, and each higher layer inherits the size of its children until we get to the innermost ring, which represents the highest layer of issue types (e.g. Initiatives and Themes).
For issues that are missing a parent, these are also represented by using a neutral colour (in the example to the right, missing parents are in white), to show what proportion of the scaled backlog has not been tagged with the Parent field correctly.
Hovering over an issue slice will show various stats about the issue, including the % Total metric, which is a calculation of how big that issue is in comparison to the total backlog. For example, a % Total value of 80% would indicate that the issue, including the size inheritance of all its children) comprise of 80% of the total backlog. These values will change depending on the Size By value selected.
Clicking on an issue will ‘drill down’ to focus on that issue and its children. Clicking again on that issue will ‘roll up’ that issue to focus on its parent, or on the rest of the backlog if the top layer is reached.
Additional Options
Colour By - Apply different colour schemes based on Status, ‘True’ Status, Issue Hierarchy Level or Size
Size By - Augment the size of each issue based on their Issue Count, Story Points, Original Time Estimate or Remaining Time Estimate
View Chart - Backlog Circle
This view can be seen after clicking the ‘Get Data’ button and navigating to Backlog Circle on the left side menu.
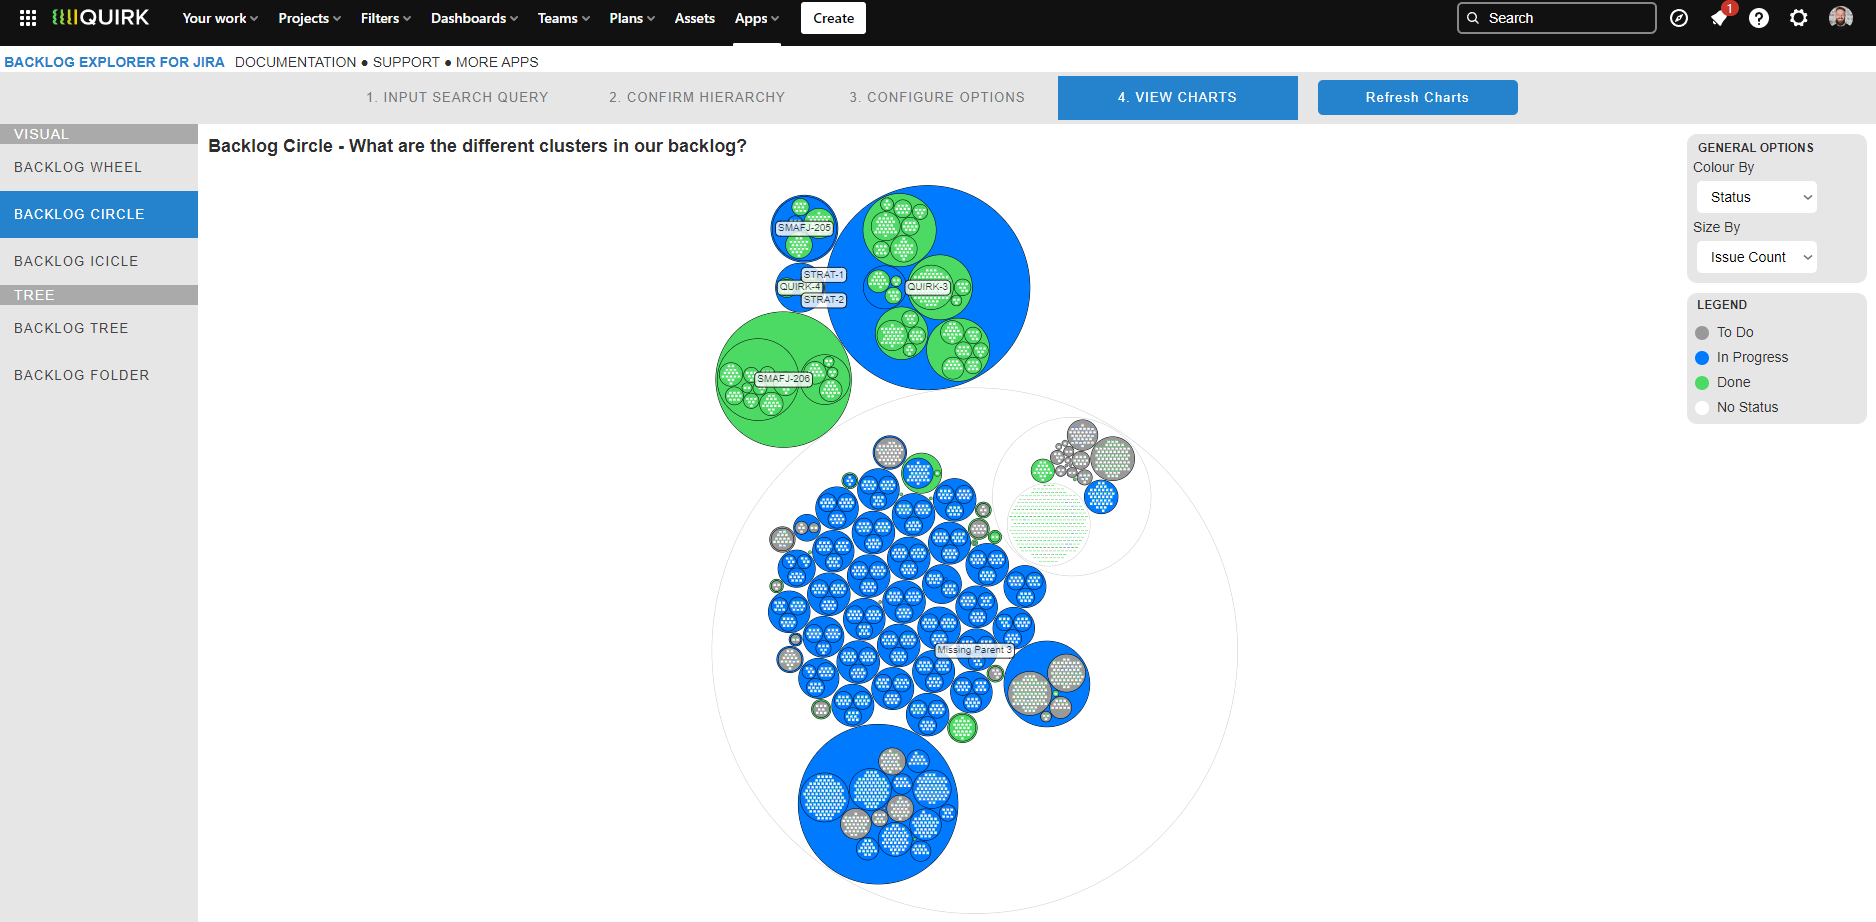
The Backlog Circle chart represents clusters of issues at the lowest Issue Hierarchy level, which are then clustered again at each parent layer to show scaled groupings within your backlog.
For issues that are missing a parent, these are represented by using a neutral colour (in the example to the right, missing parents are in white), to show what clusters of the backlog have not been tagged with the Parent field correctly.
Hovering over an issue slice will show various stats about the issue, including the % Total metric, which is a calculation of how big that issue is in comparison to the total backlog. For example, a % Total value of 80% would indicate that the issue, including the size inheritance of all its children) comprise of 80% of the total backlog. These values will change depending on the Size By value selected.
Clicking on an issue will ‘drill down’ to focus on that issue and its children. Clicking again on that issue will ‘roll up’ that issue to focus on its parent, or on the rest of the backlog if the top layer is reached.
Additional Options
Colour By - Apply different colour schemes based on Status, ‘True’ Status, Issue Hierarchy Level or Size
Size By - Augment the size of each issue based on their Issue Count, Story Points, Original Time Estimate or Remaining Time Estimate
View Chart - Backlog Icicle
This view can be seen after clicking the ‘Get Data’ button and navigating to Backlog Icicle on the left side menu.
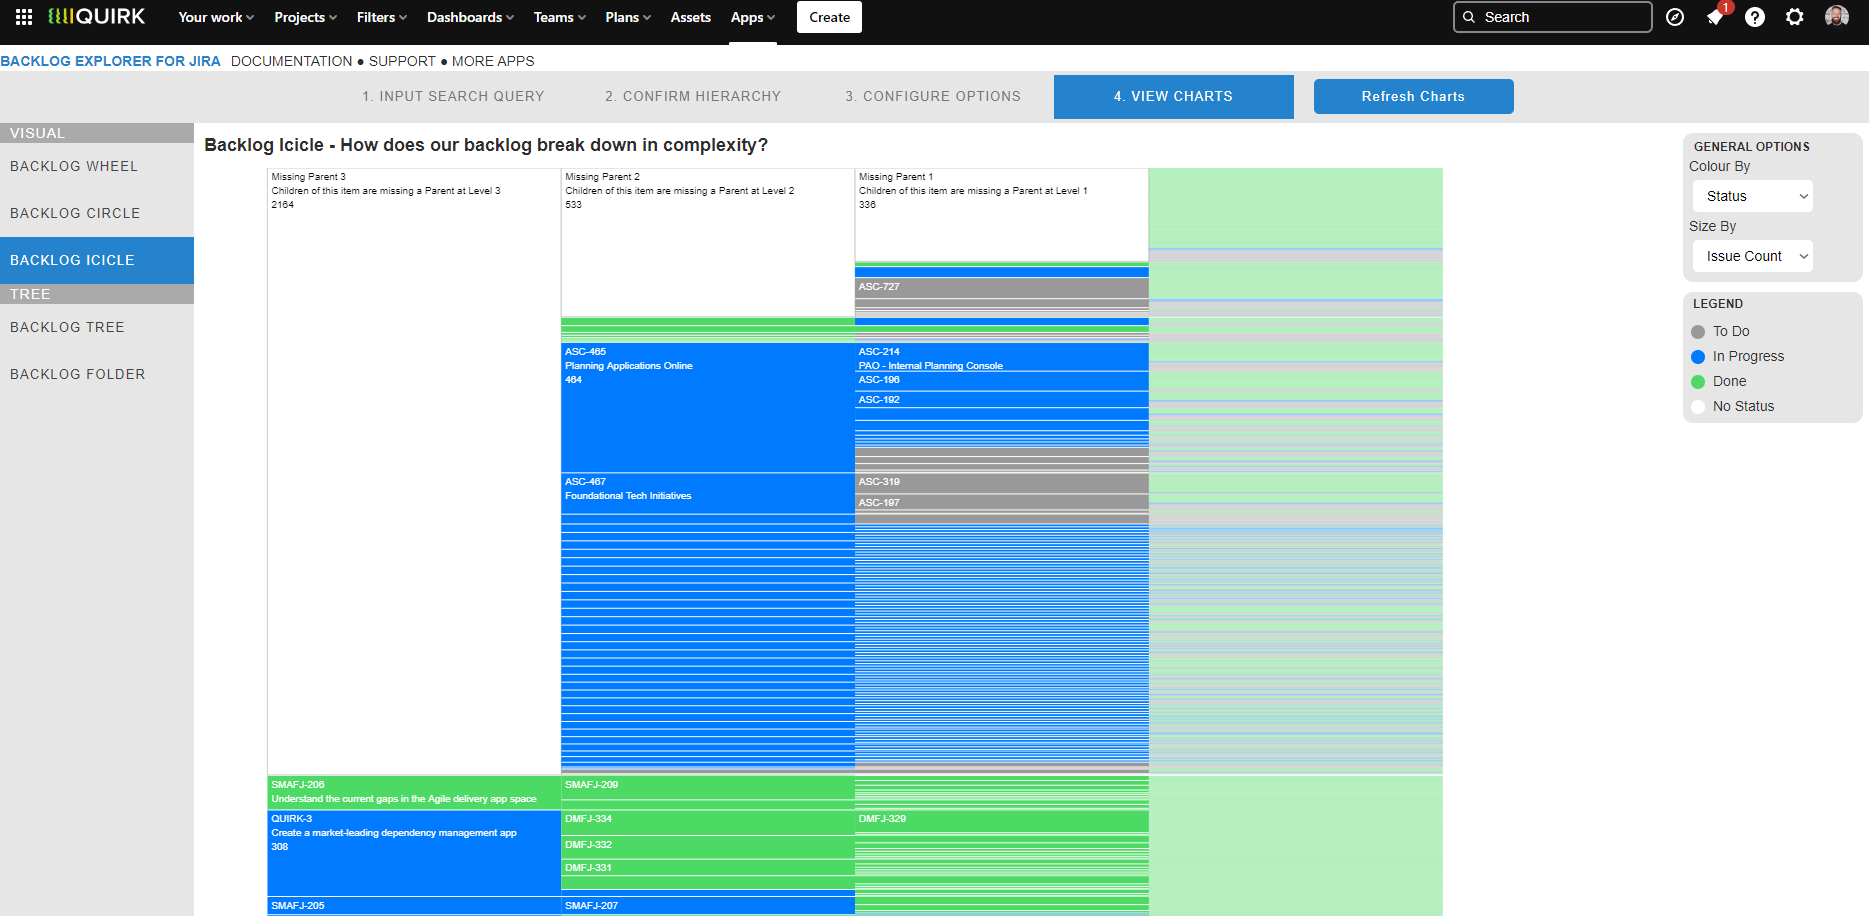
The Backlog Icicle chart represents a breakdown of Parent issues, starting with the highest level of the Issue Hierarchy on the left, and the progressive breakdown into children as we move to the right.
For issues that are missing a parent, these are represented by using a neutral colour (in the example to the right, missing parents are in white), to show what clusters of the backlog have not been tagged with the Parent field correctly.
Hovering over an issue slice will show various stats about the issue, including the % Total metric, which is a calculation of how big that issue is in comparison to the total backlog. For example, a % Total value of 80% would indicate that the issue, including the size inheritance of all its children) comprise of 80% of the total backlog. These values will change depending on the Size By value selected.
Clicking on an issue will ‘drill down’ to focus on that issue and its children. Clicking again on that issue will ‘roll up’ that issue to focus on its parent, or on the rest of the backlog if the top layer is reached.
Additional Options
Colour By - Apply different colour schemes based on Status, ‘True’ Status, Issue Hierarchy Level or Size
Size By - Augment the size of each issue based on their Issue Count, Story Points, Original Time Estimate or Remaining Time Estimate
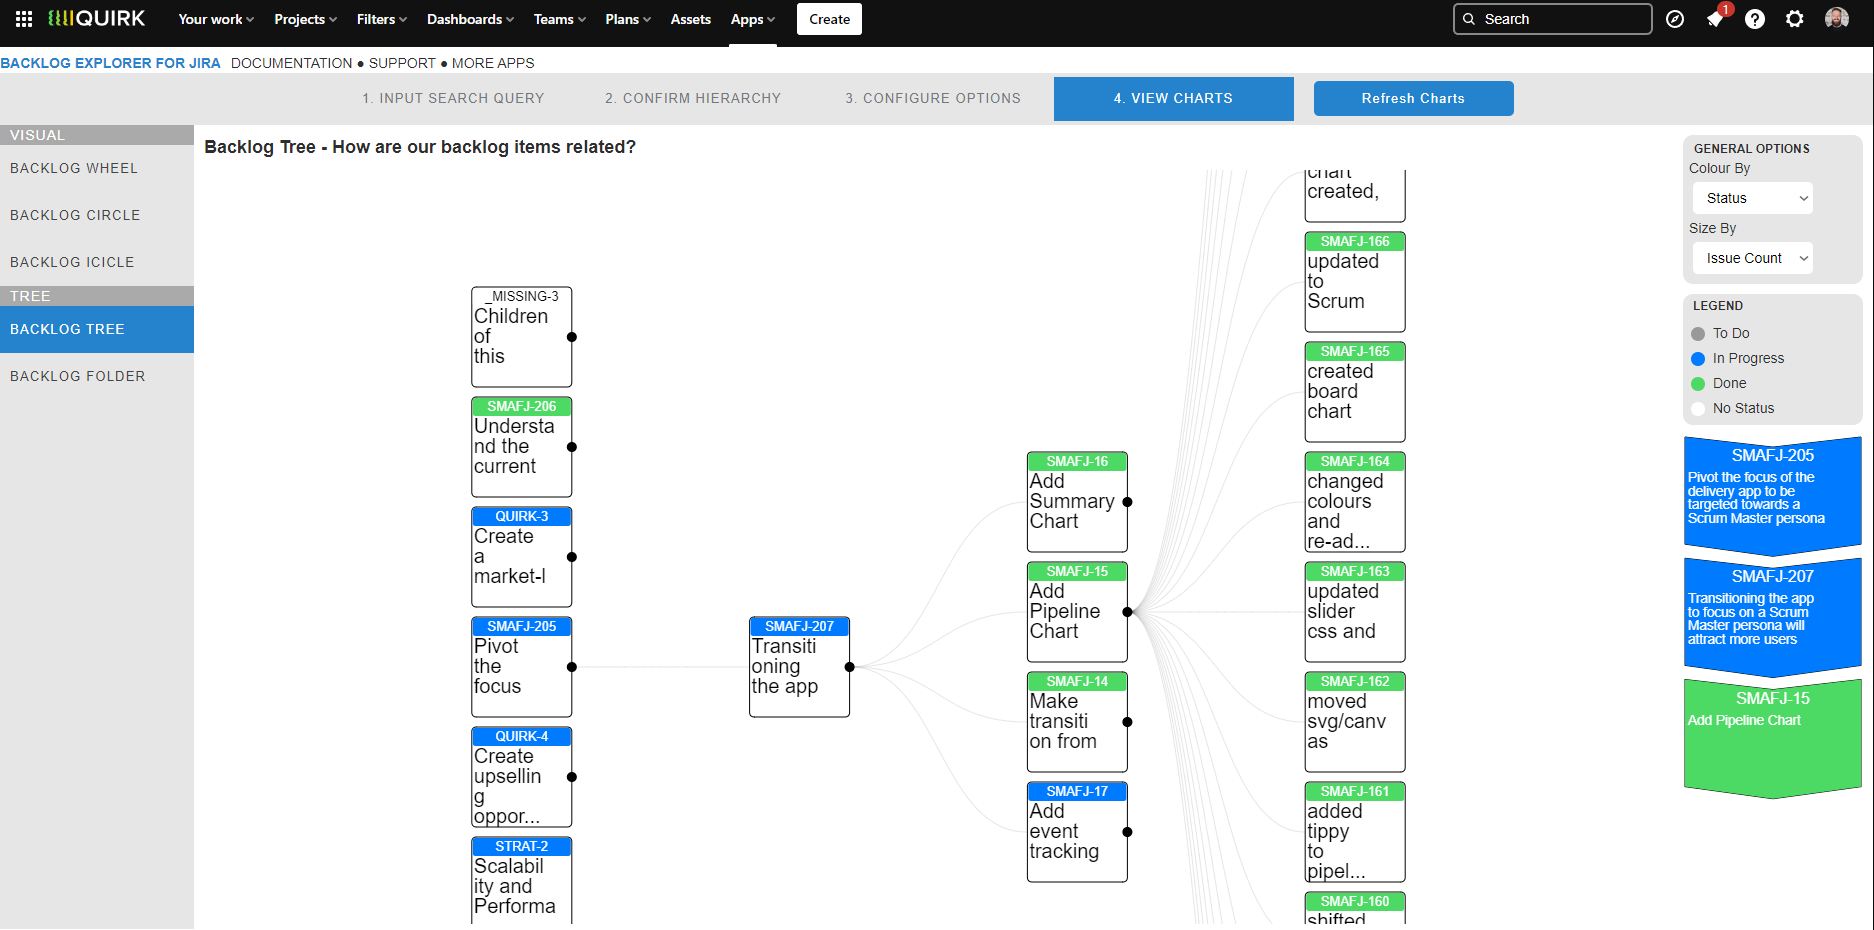
View Chart - Backlog Tree
This view can be seen after clicking the ‘Get Data’ button and navigating to Backlog Tree on the left side menu.
Similar to the Backlog Icicle chart, the Backlog Tree shows a logical breakdown of a scaled backlog, from left (highest Issue Hierarchy level) to right (lowest Issue Hierarchy level). Issues with a black node can be drilled into as they have children.
For issues that are missing a parent, these are represented by using a neutral colour (in the example to the right, missing parents are in white), to show what children within the backlog have not been tagged with the Parent field correctly.
Hovering over an issue slice will show various stats about the issue, including the % Total metric, which is a calculation of how big that issue is in comparison to the total backlog. For example, a % Total value of 80% would indicate that the issue, including the size inheritance of all its children) comprise of 80% of the total backlog. These values will change depending on the Size By value selected.
Clicking on an issue will ‘drill down’ to focus on that issue and its children. Clicking again on that issue will ‘roll up’ that issue to focus on its parent, or on the rest of the backlog if the top layer is reached.
Additional Options
Colour By - Apply different colour schemes based on Status, ‘True’ Status, Issue Hierarchy Level or Size
Size By - Augment the size of each issue based on their Issue Count, Story Points, Original Time Estimate or Remaining Time Estimate
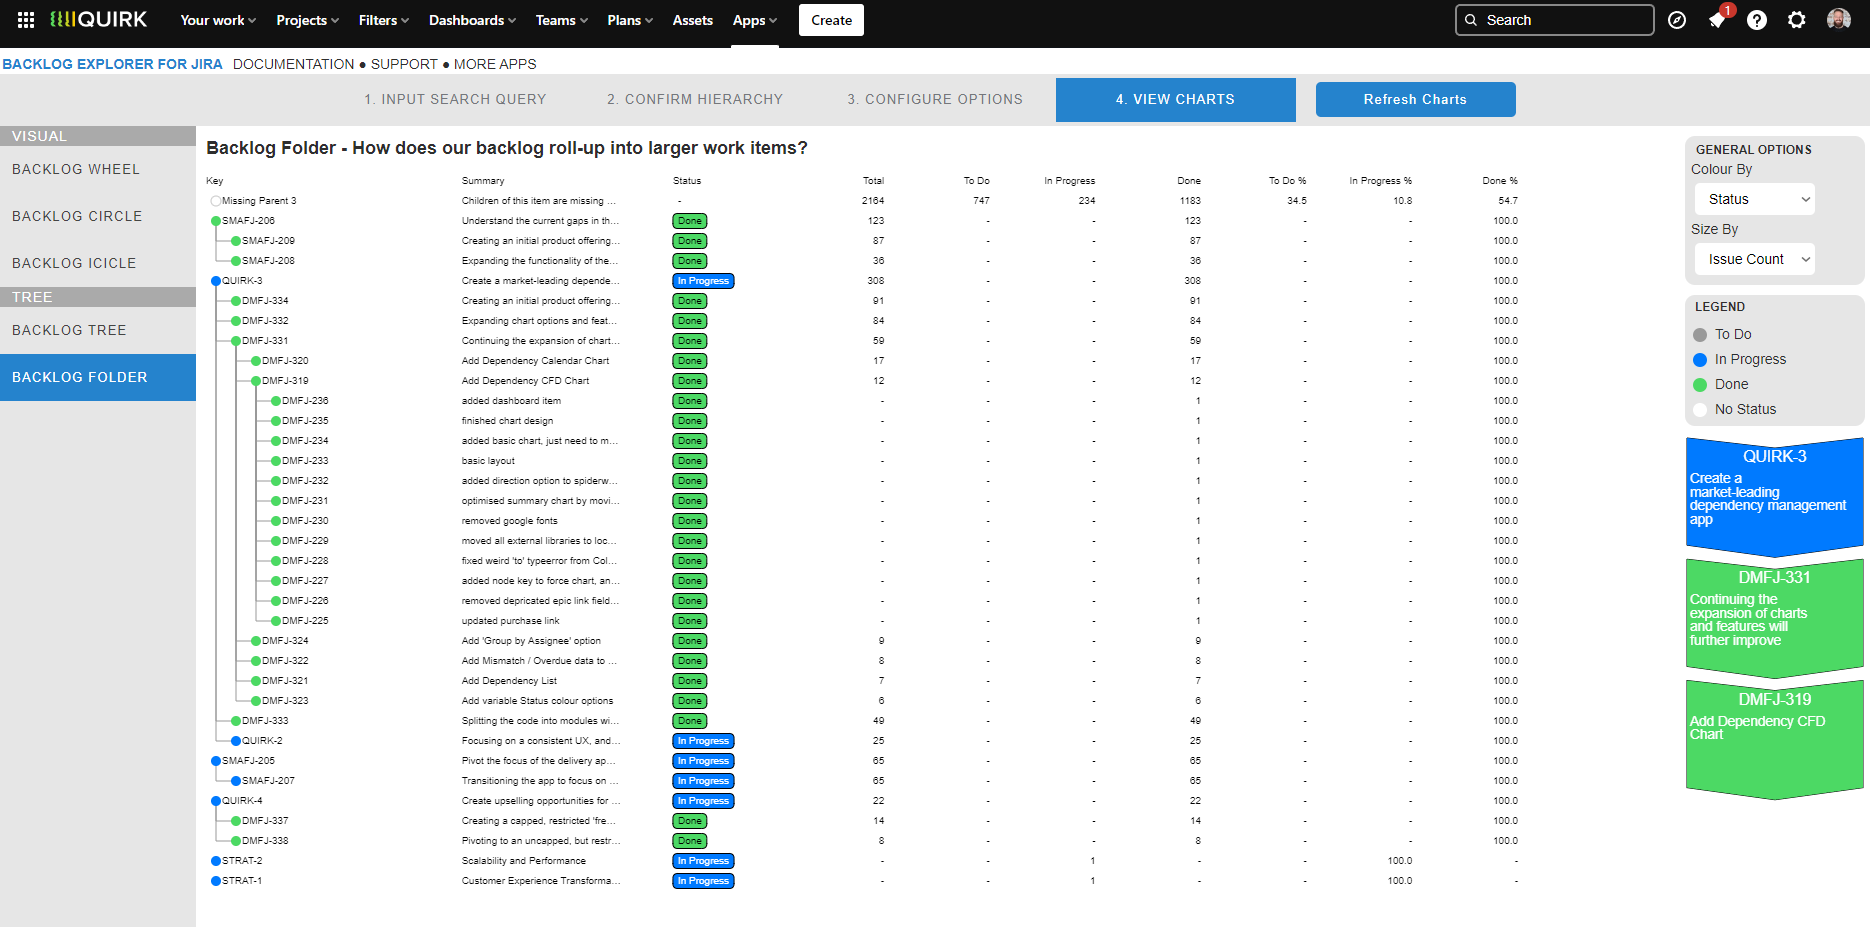
View Chart - Backlog Folder
This view can be seen after clicking the ‘Get Data’ button and navigating to Backlog Folder on the left side menu.
The Backlog Folder shows a compartmentalised view of a scaled backlog by arranging issues into a folder structure, alongside various statistics to indicate the size and overall completion of each issue based on their children.
For issues that are missing a parent, these are represented by using a neutral colour (in the example to the right, missing parents are in white), to show what children within the backlog have not been tagged with the Parent field correctly.
Hovering over an issue slice will show various stats about the issue, including the % Total metric, which is a calculation of how big that issue is in comparison to the total backlog. For example, a % Total value of 80% would indicate that the issue, including the size inheritance of all its children) comprise of 80% of the total backlog. These values will change depending on the Size By value selected.
Clicking on an issue will ‘drill down’ to focus on that issue and its children. Clicking again on that issue will ‘roll up’ that issue to focus on its parent, or on the rest of the backlog if the top layer is reached.
Additional Options
Colour By - Apply different colour schemes based on Status, ‘True’ Status, Issue Hierarchy Level or Size
Size By - Augment the size of each issue based on their Issue Count, Story Points, Original Time Estimate or Remaining Time Estimate