Onboarding Guide - For Users
Welcome to Board Rewind for Jira! This step-by-step guide will walk you through creating your first timeline visualisation and exploring your board's history.
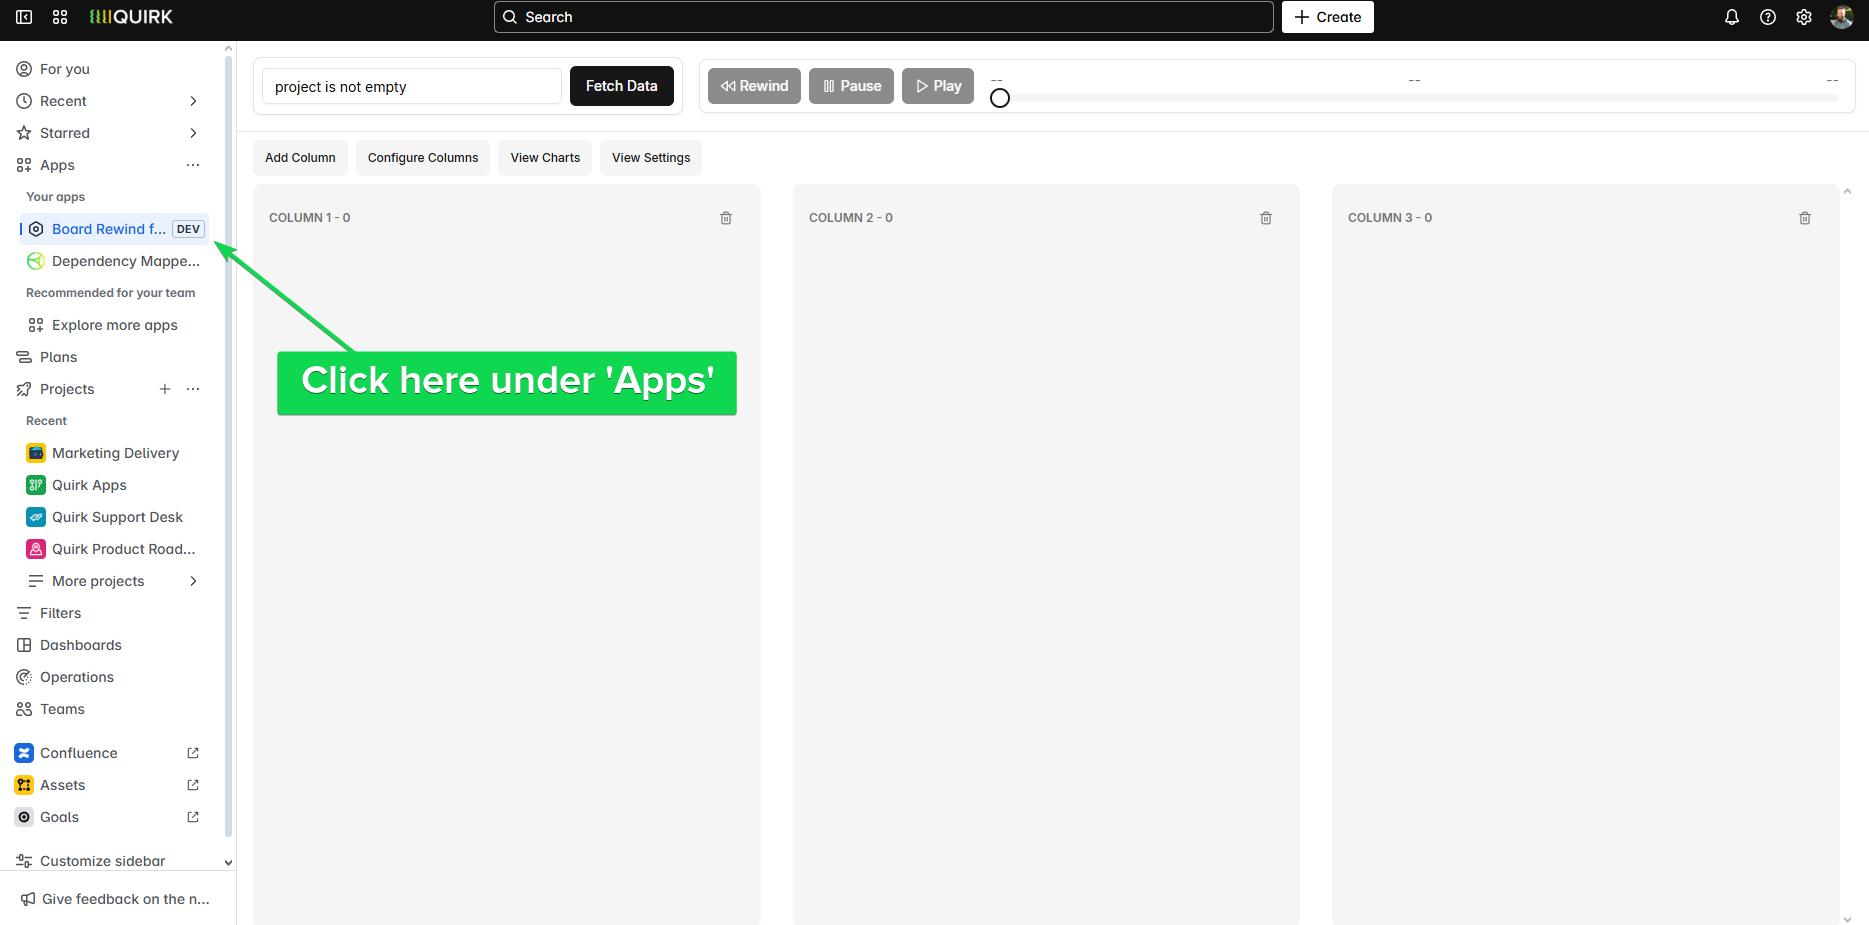
Step 1: Navigate to the Board Rewind for Jira app under the Apps section
Click on "Apps" in your Jira navigation bar and select "Board Rewind" from the dropdown menu. This will open the Board Rewind interface where you can begin exploring your board timelines.
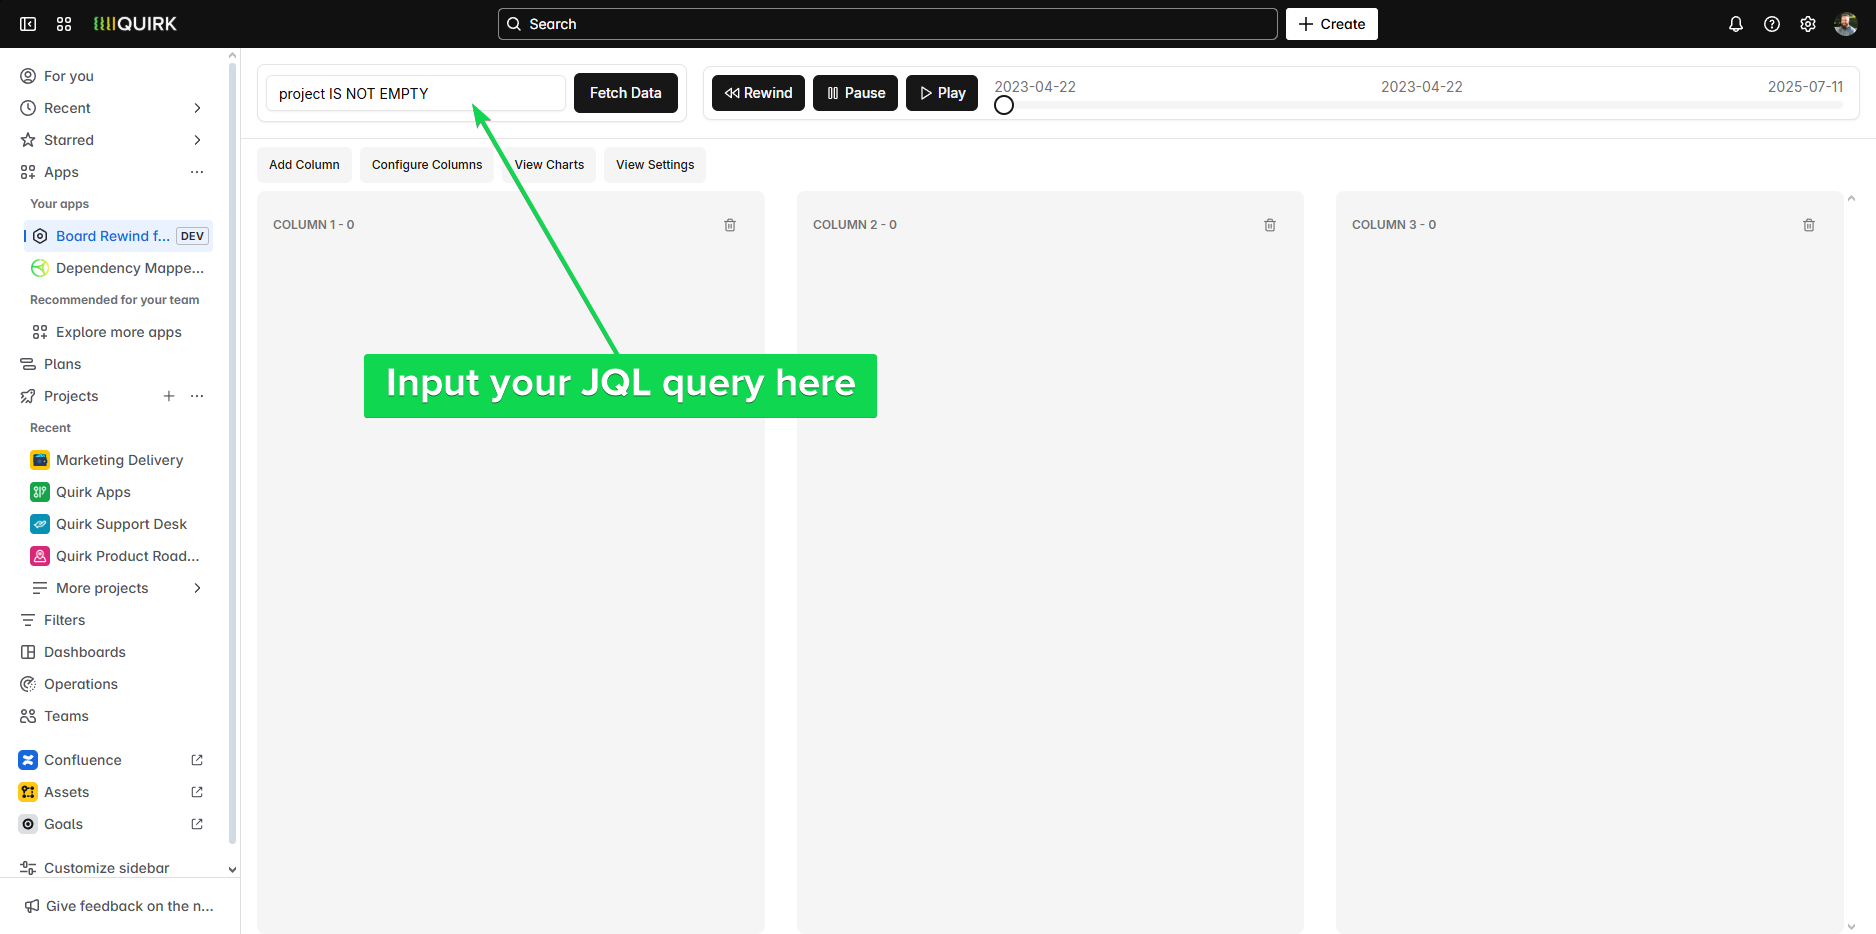
Step 2: Enter your JQL query in the top left corner, or select from a project dropdown and select 'Get Data'
You have two options to load your data:
Option A: Enter a custom JQL query in the search box for specific issue filtering (e.g., project = "My Project" AND sprint = 23)
Option B: Use the project dropdown to select your desired project, then click the "Get Data" button
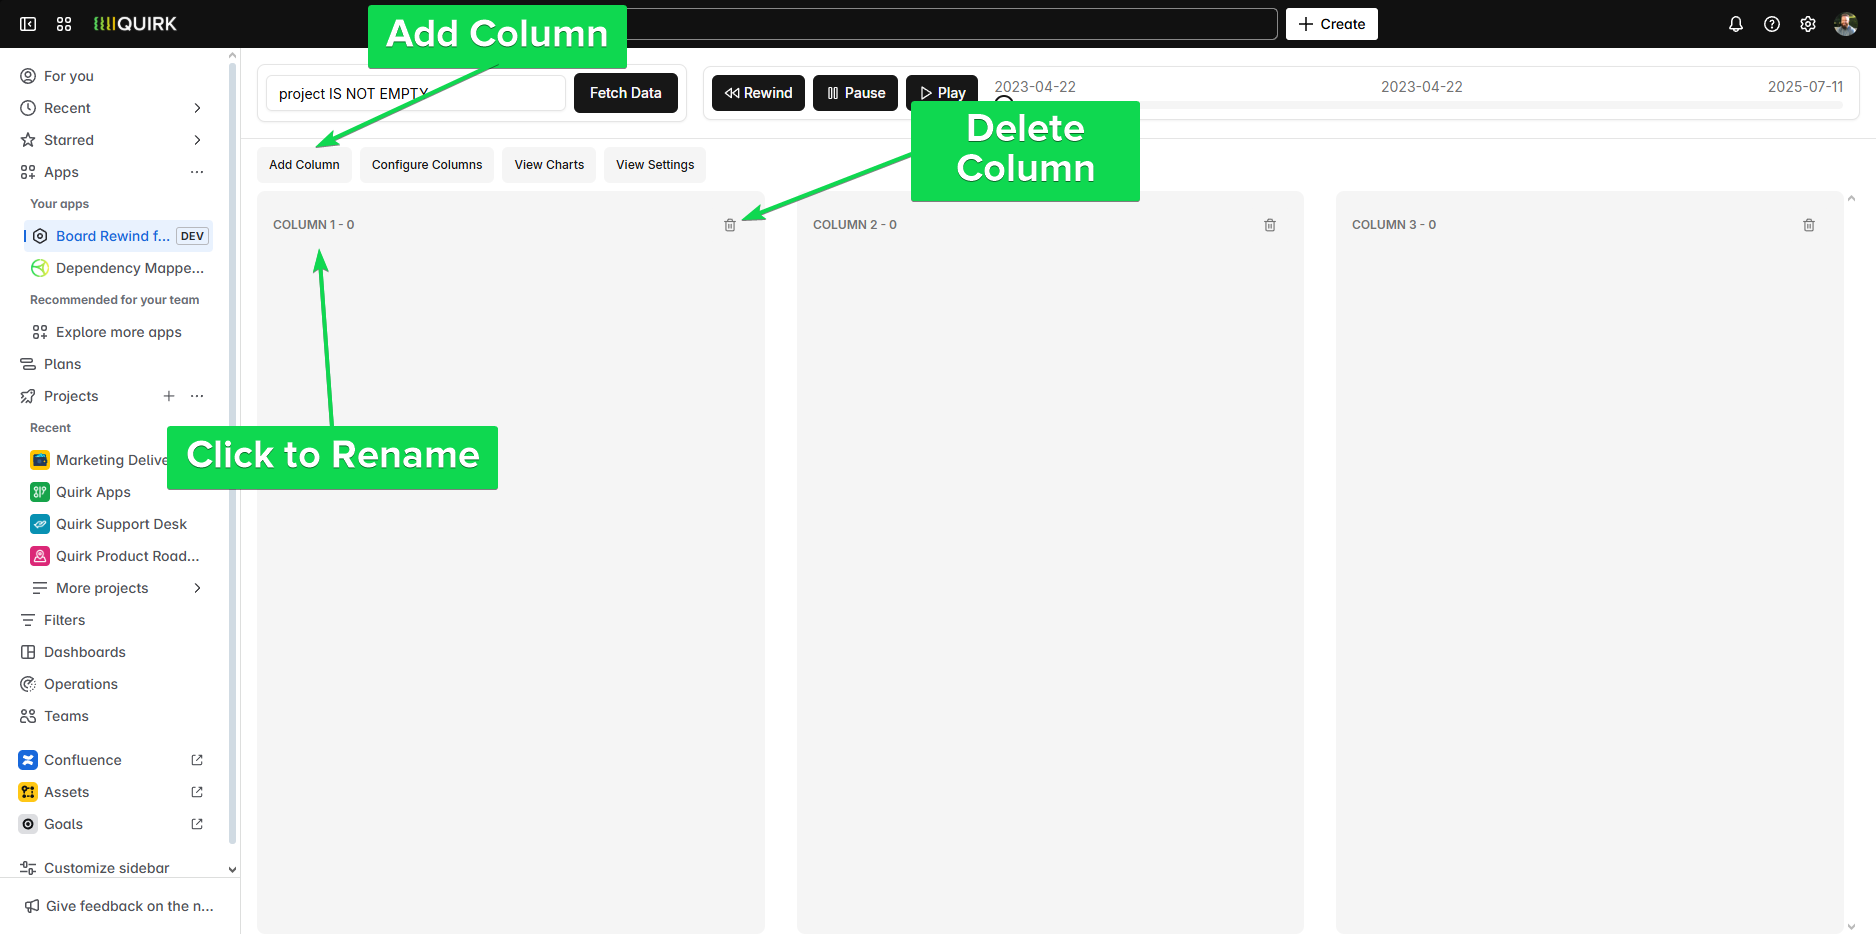
Step 3: Use the 'Add Column' button to add new columns to the board, or the trash can icon to delete columns
Customise your board layout to match your workflow:
Click "Add Column" to create additional status columns
Use the trash can icon next to any column to remove it
This helps you focus on the statuses that matter most to your analysis
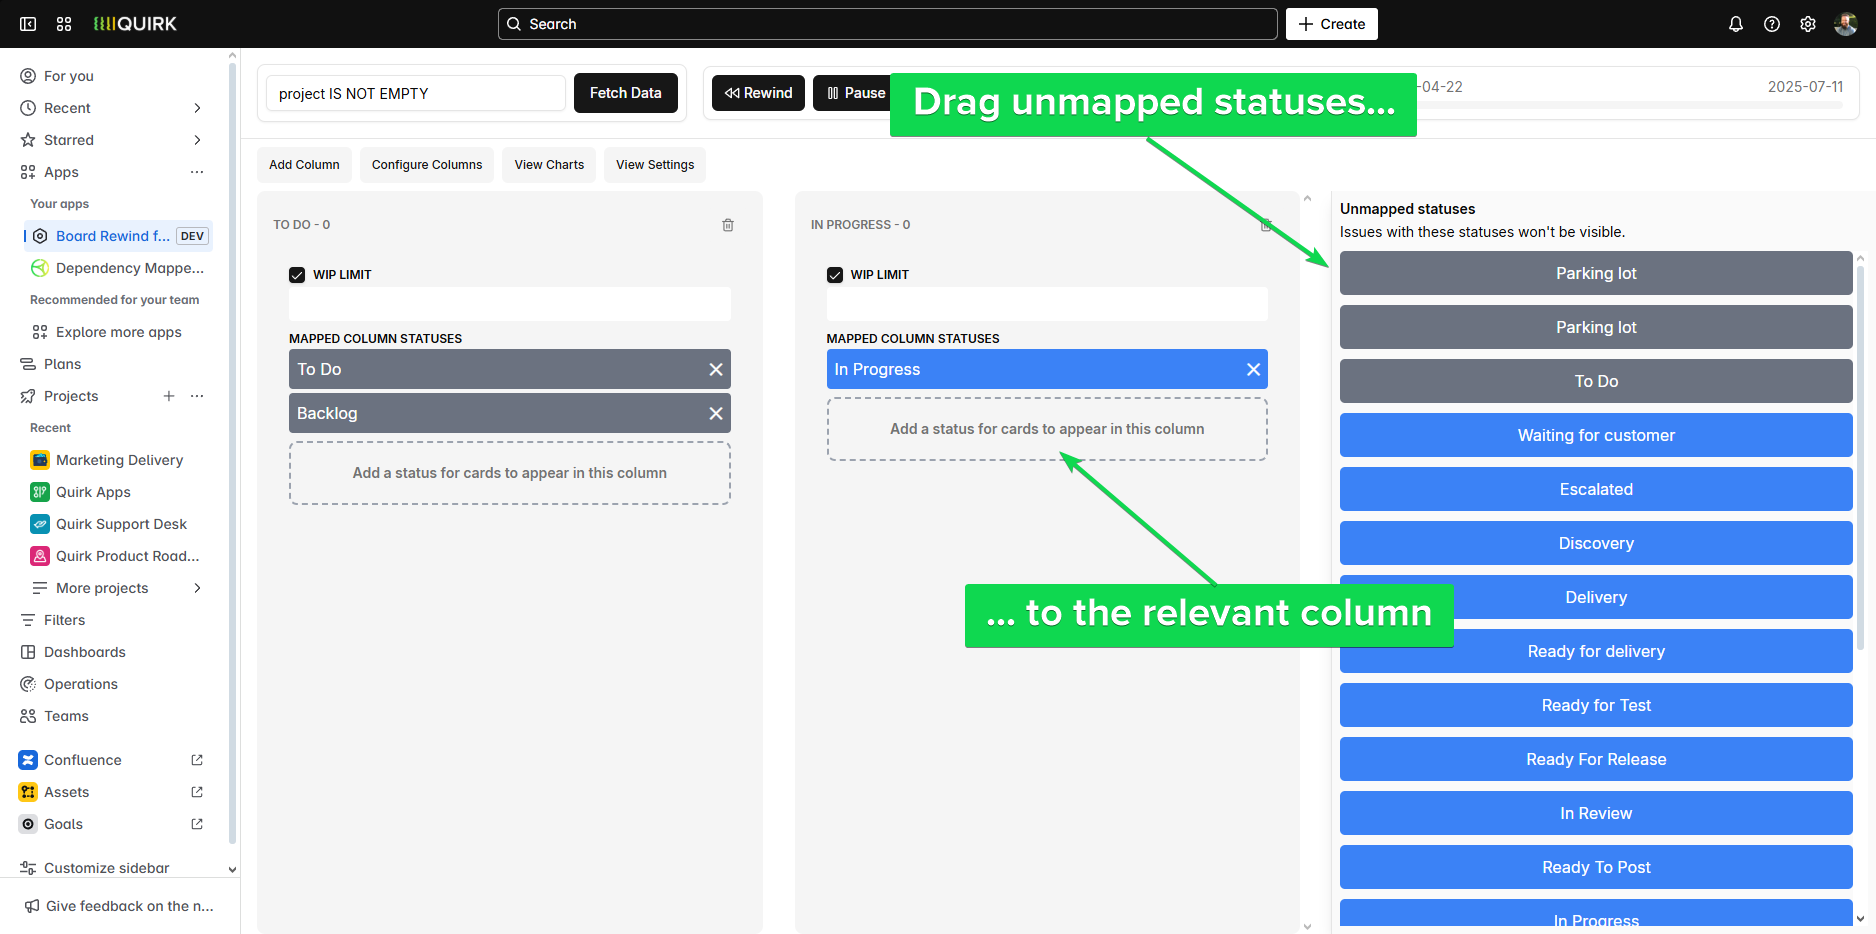
Step 4: Once the data has been collected, click 'Configure Columns' and use the drag and drop functionality to map statuses
Map your Jira statuses to the appropriate board columns:
Click "Configure Columns" to open the mapping interface
Drag and drop Jira statuses from the left panel into the appropriate columns
This ensures your timeline accurately reflects how work flows through your process
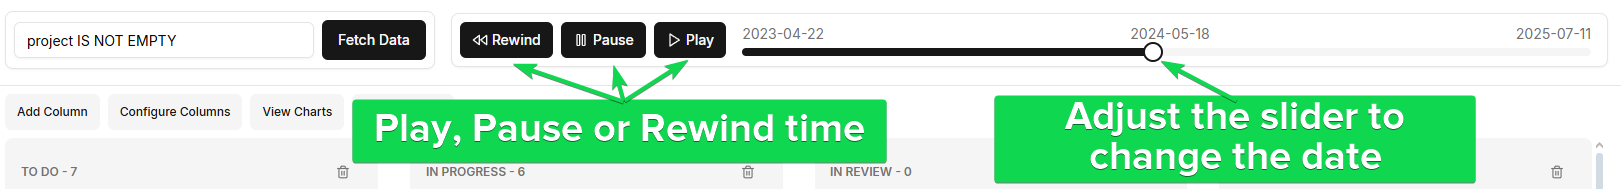
Step 5: Then, use the 'Rewind', 'Pause' and 'Play' icons in the Timeline (top right section), or scrub the slider to the relevant date you wish to start from
Control your timeline playback:
Rewind: Jump backwards in time to see earlier board states
Play: Watch issues move through statuses in chronological order
Pause: Stop at any moment to examine the board in detail
Timeline Slider: Drag to jump directly to any specific date
Step 6: You can now watch the cards go through their historical transitions day on day!
Sit back and observe how your work really flowed:
Watch issues appear as they're created or added to the board
See cards move between columns as status transitions occur
Notice patterns like bottlenecks, rework loops, or workflow interruptions
Use pause to discuss interesting moments with your team
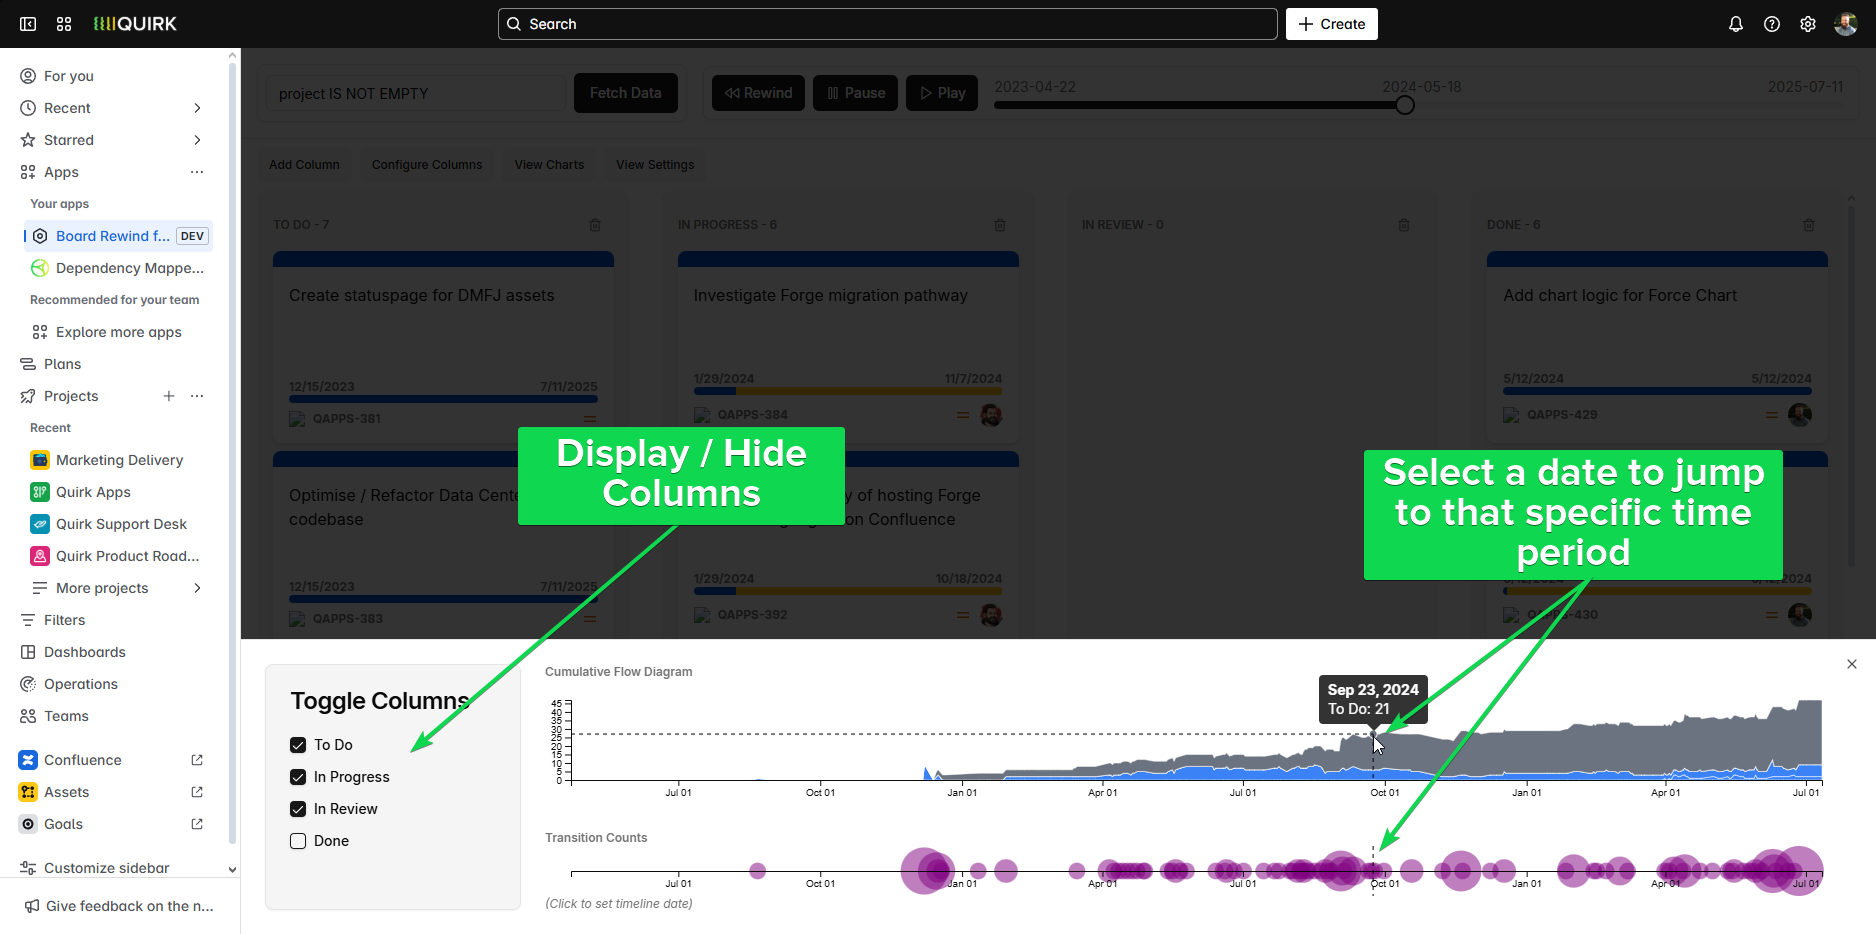
Step 7: Alternatively, you can click the 'View Charts' section and select the relevant time period on the Cumulative Flow Diagram to jump to that section
Explore your flow data with charts:
Click "View Charts" to see cumulative flow diagrams and transition heatmaps
Click any point on the Cumulative Flow Diagram to jump directly to that moment in your timeline
Use charts to identify patterns and then investigate them with timeline playback
You're Ready to Explore!
Congratulations! You've set up your first Board Rewind timeline. Here are some tips to get the most value:
Start with recent sprints to see familiar patterns in your data
Use charts first to spot interesting periods, then investigate with timeline controls
Experiment with different time ranges to understand long-term workflow trends
Share timelines with your team during retrospectives and planning sessions
Need help? Check out our use case guides or contact support at hello@quirk.com.au