Configure Chart Options
Configure Options
General Options
Include Internal Dependencies - Will either include or exclude dependencies that are of the same grouping
e.g. If you were grouping issues by Project (under Grouping Options) and toggled off this option, this would exclude dependencies where both issues belonged to the same Project. |
|---|
Include Resolved Dependencies - Will either include or exclude dependencies where either issue has a Status Category of DONE (i.e. a green status)
Include Issues with No Dependencies - WIll either include or exclude dependencies that have zero dependencies associated with an issue
Dark Mode - Toggles the Dark Mode or Light Mode themes of the app
Grouping Colour Theme - Determines the themes for the following charts:
Dependency SummaryDependency BoardDependency ListDependency TimelineIndividual DependenciesGrouped DependenciesDependency MatrixDependency NetworkDependency Spiderweb
Show Mismatched Due Dates - Will display a yellow ⚠️ icon to show issues that have a linkage that is due after the original. For example, if
ABC-123(due Jan 1st) is blocked byDEF-456(due Feb 1st), then this is considered a mismatch. This will display on the following charts:Dependency BoardDependency ListDependency Spiderweb
Show Overdue Issues - WIll display a red
 icon (but with a !) to show issues that are overdue based on their due date. For example, if
 ABC-123is due on Jan 1st, but the current date is Feb 1st, then the issue is considered overdue. This will display on the following charts:Dependency BoardDependency ListDependency Spiderweb
Draw Reference Line - Will draw a line highlighting the current date on the
Dependency BoardchartGroup Issues By - Will group the issues together by
Project,Epic,SprintorFix VersionGroup Dates By - Will group the ‘due date’ of each dependency by each issue’s
Sprint End Date,Fix Version Release Date,Issue Due Date, or theEarliest/Latestof those three options
e.g. If one Project were using Sprints on a Scrum board, but another Project was using Fix Version on a Kanban board, you could use the |
|---|
Periodically Refresh Data - When enabled, a full refresh of the data will be performed in the background after the initial charts are generated
Refresh Frequency - Determines how often the data is refreshed
Note: Be mindful that each refresh involves making several API calls, so ensure the refresh frequency is ‘sensible’! |
|---|
Calculate Capacity - If toggled, this will add additional cells to the
Dependency Boardchart to show the capacity for each grouping (row) and date (column)Capacity Definition - Determines how capacity is calculated. Options are
Total Issues,Story Points,Original Time Estimate, orRemaining Time Estimate
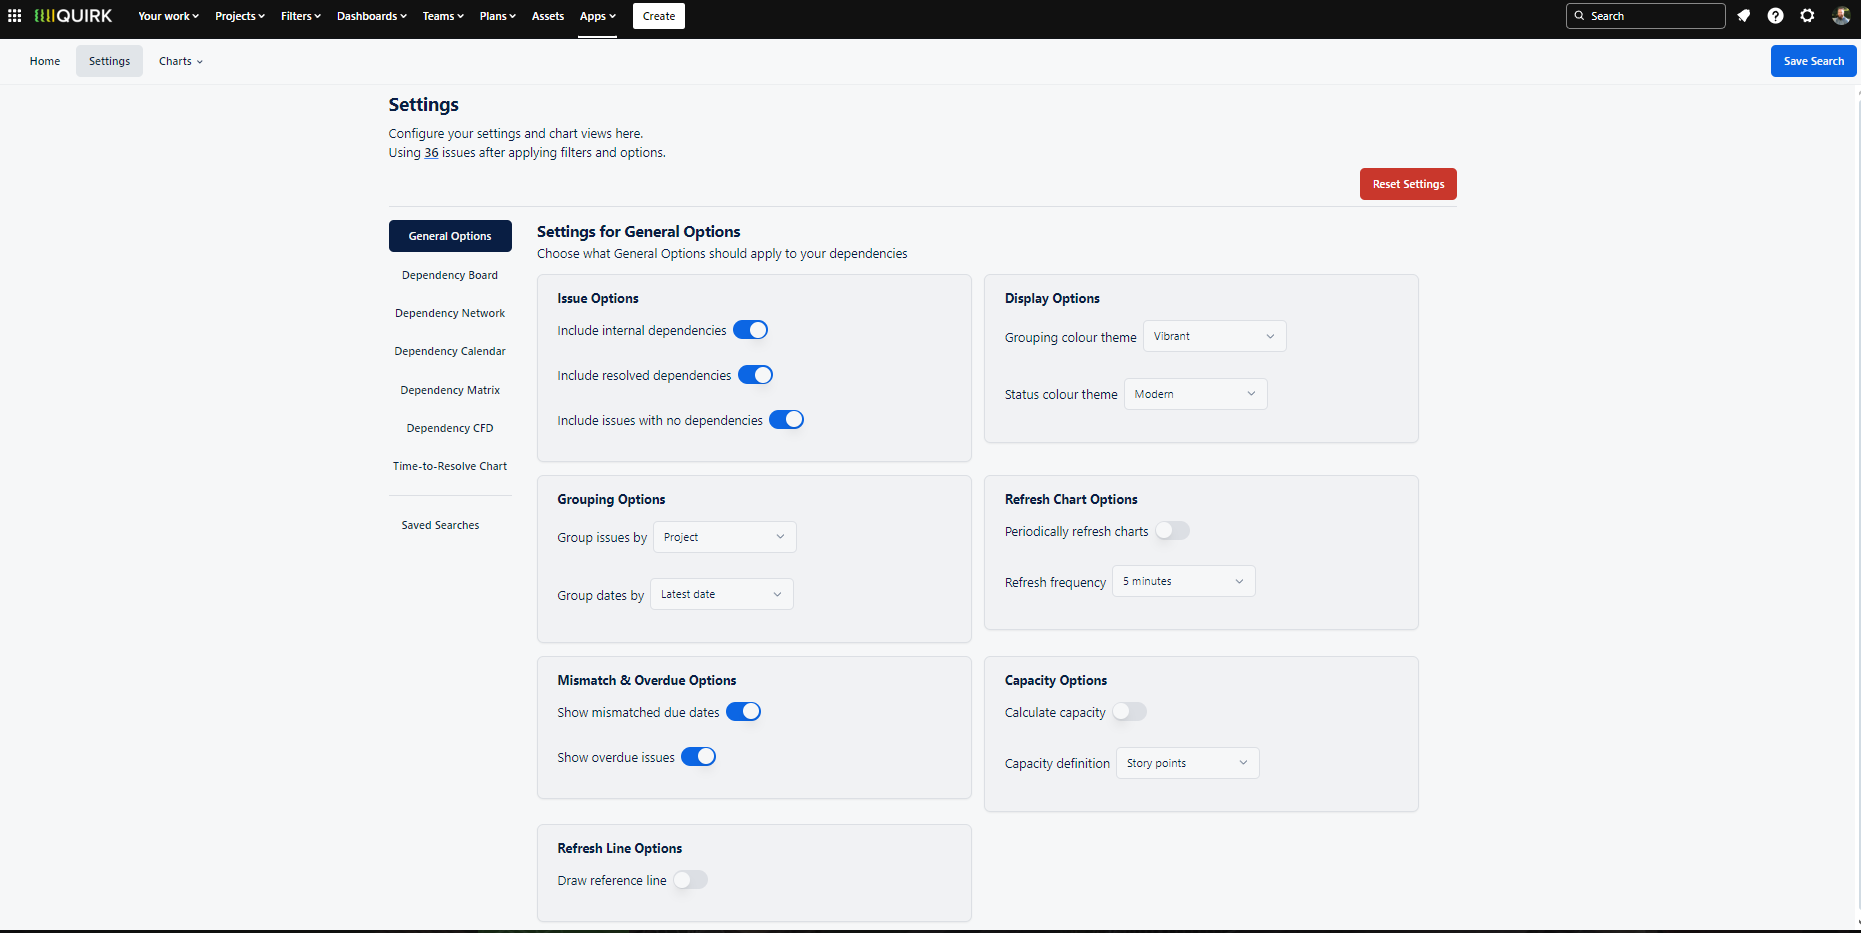
The General Options panel provides comprehensive settings to customise your dependency visualisations, from grouping and filtering options to visual preferences and data refresh settings.
‘Dependency Board’ Options
String Colour - Determines the string colour
String Thickness - Determines the string thickness
Edit Issue Mode - When clicking on an issue on the Dependency Board, this will either enable or disable the ability to dynamically edit the dependencies of an issue in the app itself (disabling this feature will simply load up the issue in a separate tab)
Root Cause Colour - Determines the colour of issues with a high ‘root cause’ value when the toggle is enabled on the
Dependency BoardchartPlace ‘Dependency String’ in front of Issues - Will place the ‘string’ either in front of, or behind the issues for the sake of controlling visual noise on the board
Place Issues without Due Dates in last column - Will place issues that don’t have an associated date (under Grouping Options) in either the first or last column of the Dependency Board
Show Issue Summary on Zoom - Sets the zoom threshold for when the Dependency Board switches between displaying the Summary and the Description of each issue
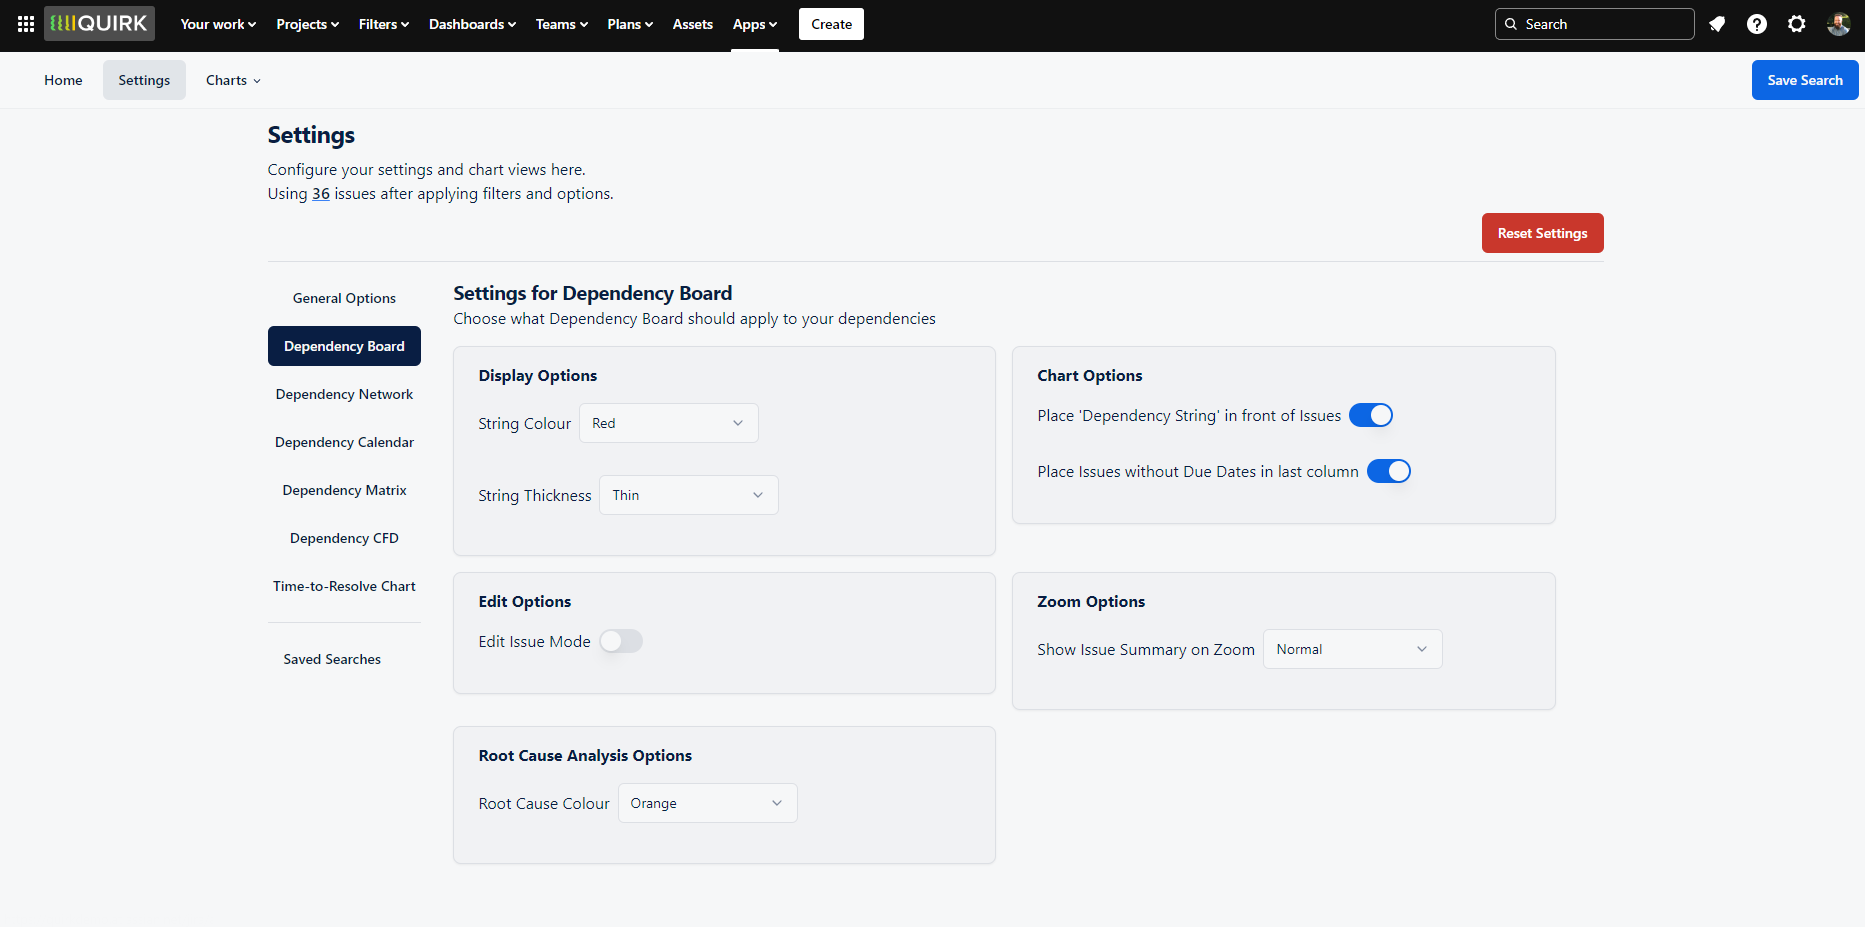
Configure the visual styling and interactive features of your Dependency Board through customisable settings for string appearance, issue display, and interaction modes.
‘Dependency Network’ Options
Dependency Direction - Determines the arrow direction for issue links (i.e. ‘A blocks B' or 'B is blocked by A’)
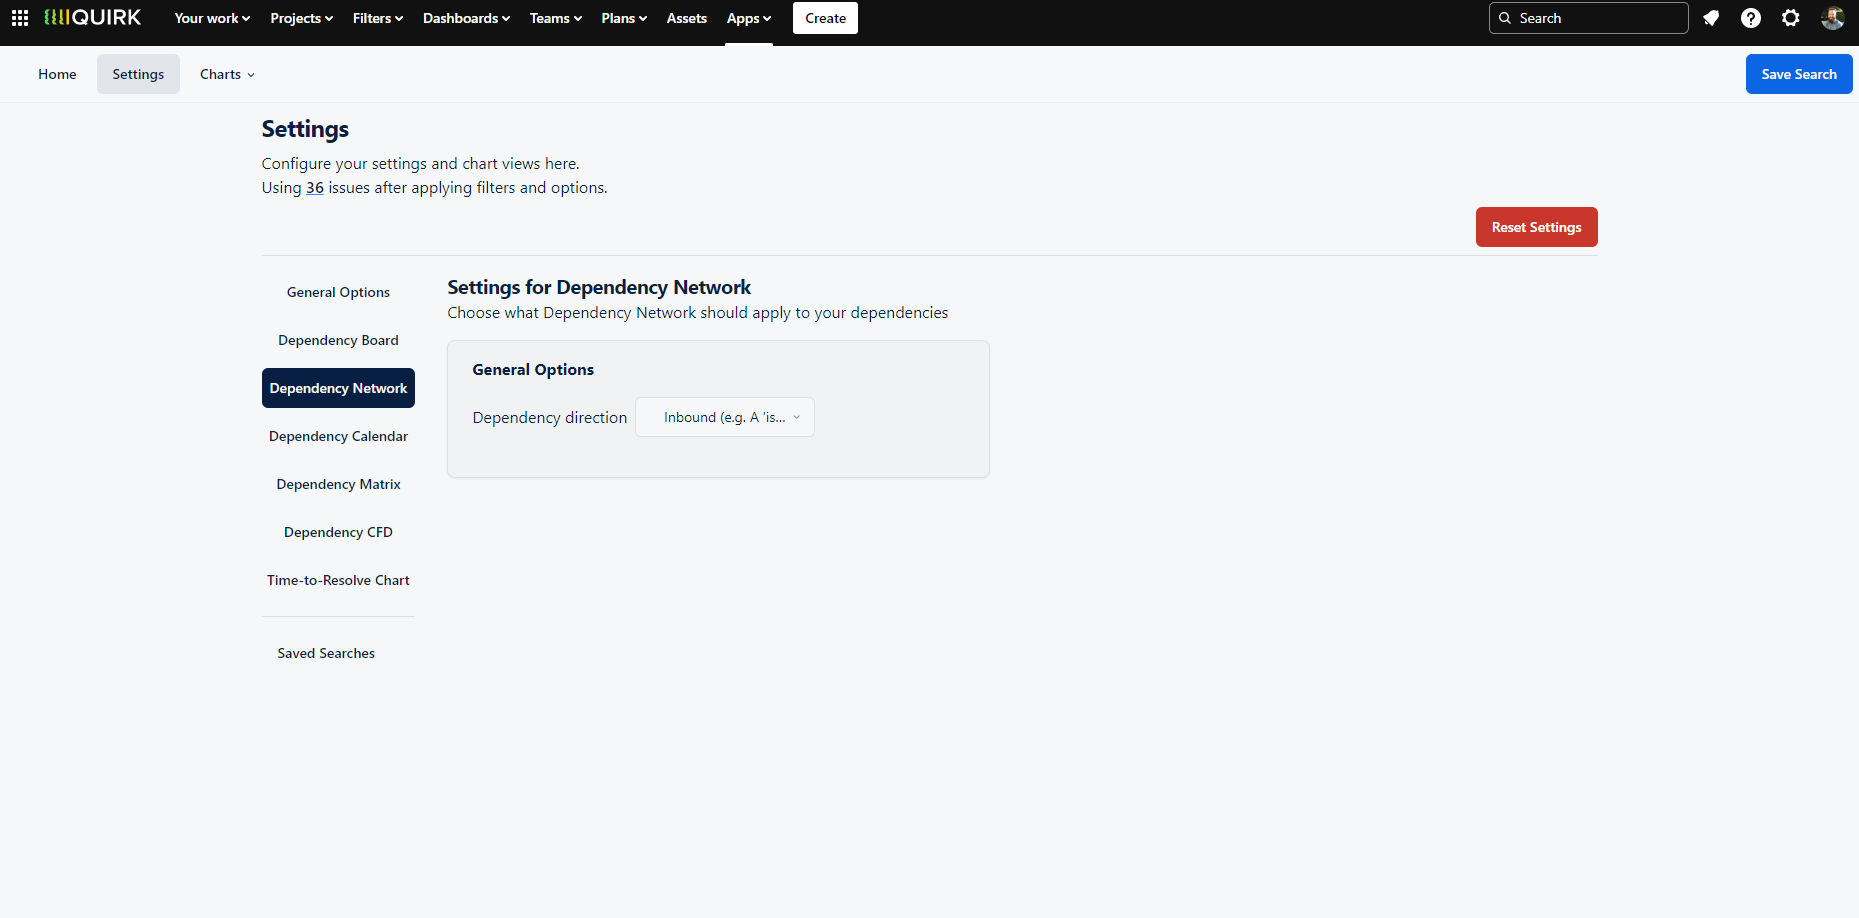
Configure how dependencies flow through your network diagram by setting the directional relationship between linked issues.
‘Dependency Calendar’ Options
Cell Colour - Determines the colour theme for dates with a high value of dependencies
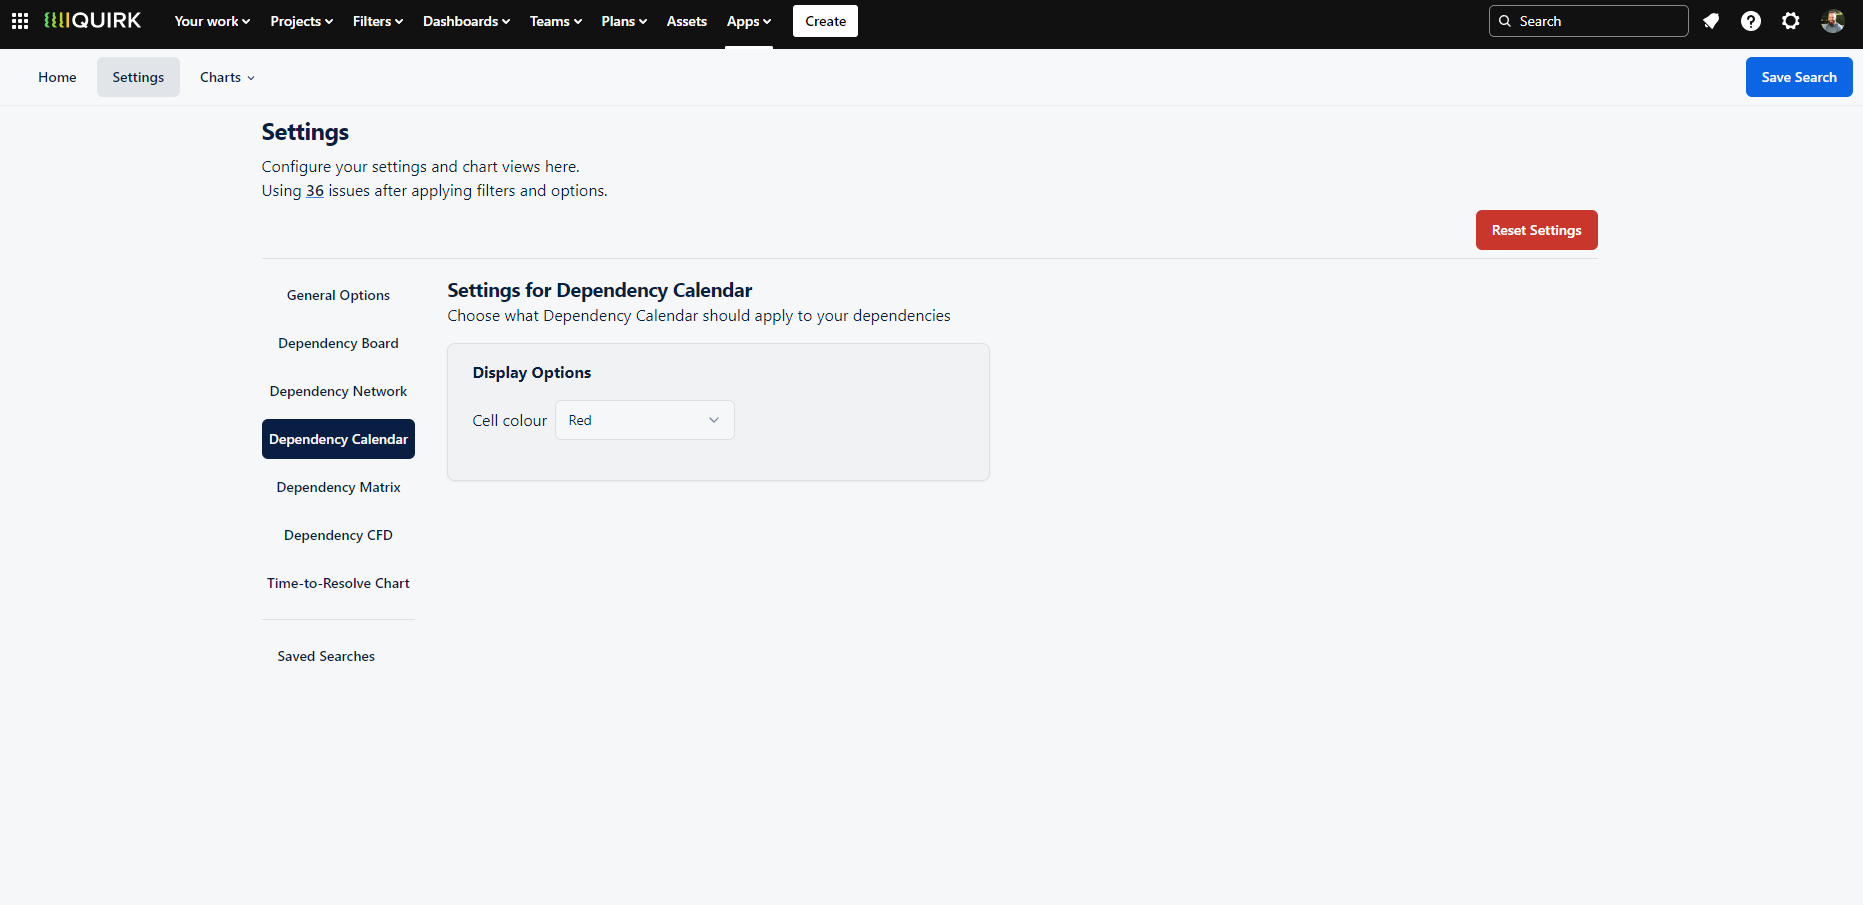
Customise the visual appearance of your Dependency Calendar by adjusting the colour scheme used to highlight dates with concentrated dependencies.
‘Dependency Matrix’ Options
Cell Colour - Determines the colour theme for groups with a high value of dependencies
Axis Labels - Shows either the group name (e.g. Project Name) or group id (e.g. Project Key) on the X and Y axes
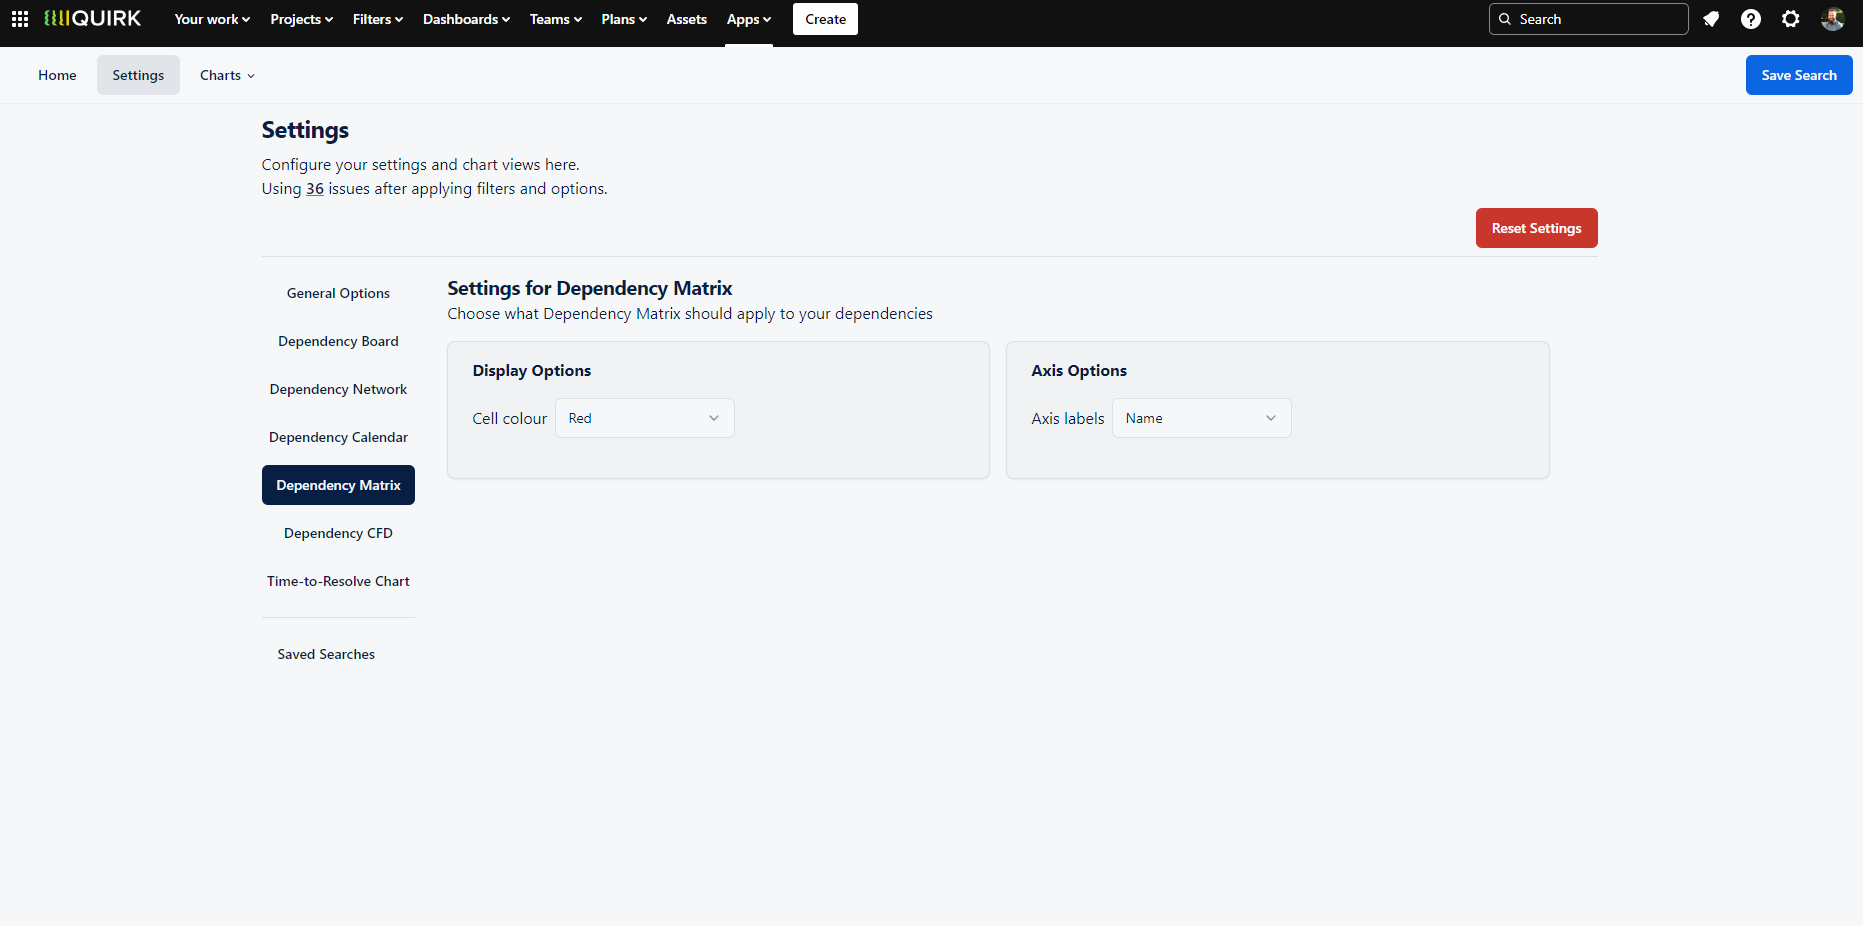
Customise the visual style of your Dependency Matrix by adjusting the colour theme for dependency concentrations and choosing how groups are labelled on each axis.
‘Dependency CFD’ Chart Options
CFD Colour - Determines the colour of the Cumulative Flow Diagram (CFD) chart
CFD Delta Increase Colour- Determines the colour of the Cumulative Flow Diagram (CFD) Delta chart when an increase is observed for that date period
CFD Delta Decrease Colour - Determines the colour of the Cumulative Flow Diagram (CFD) Delta chart when a decrease is observed for that date period
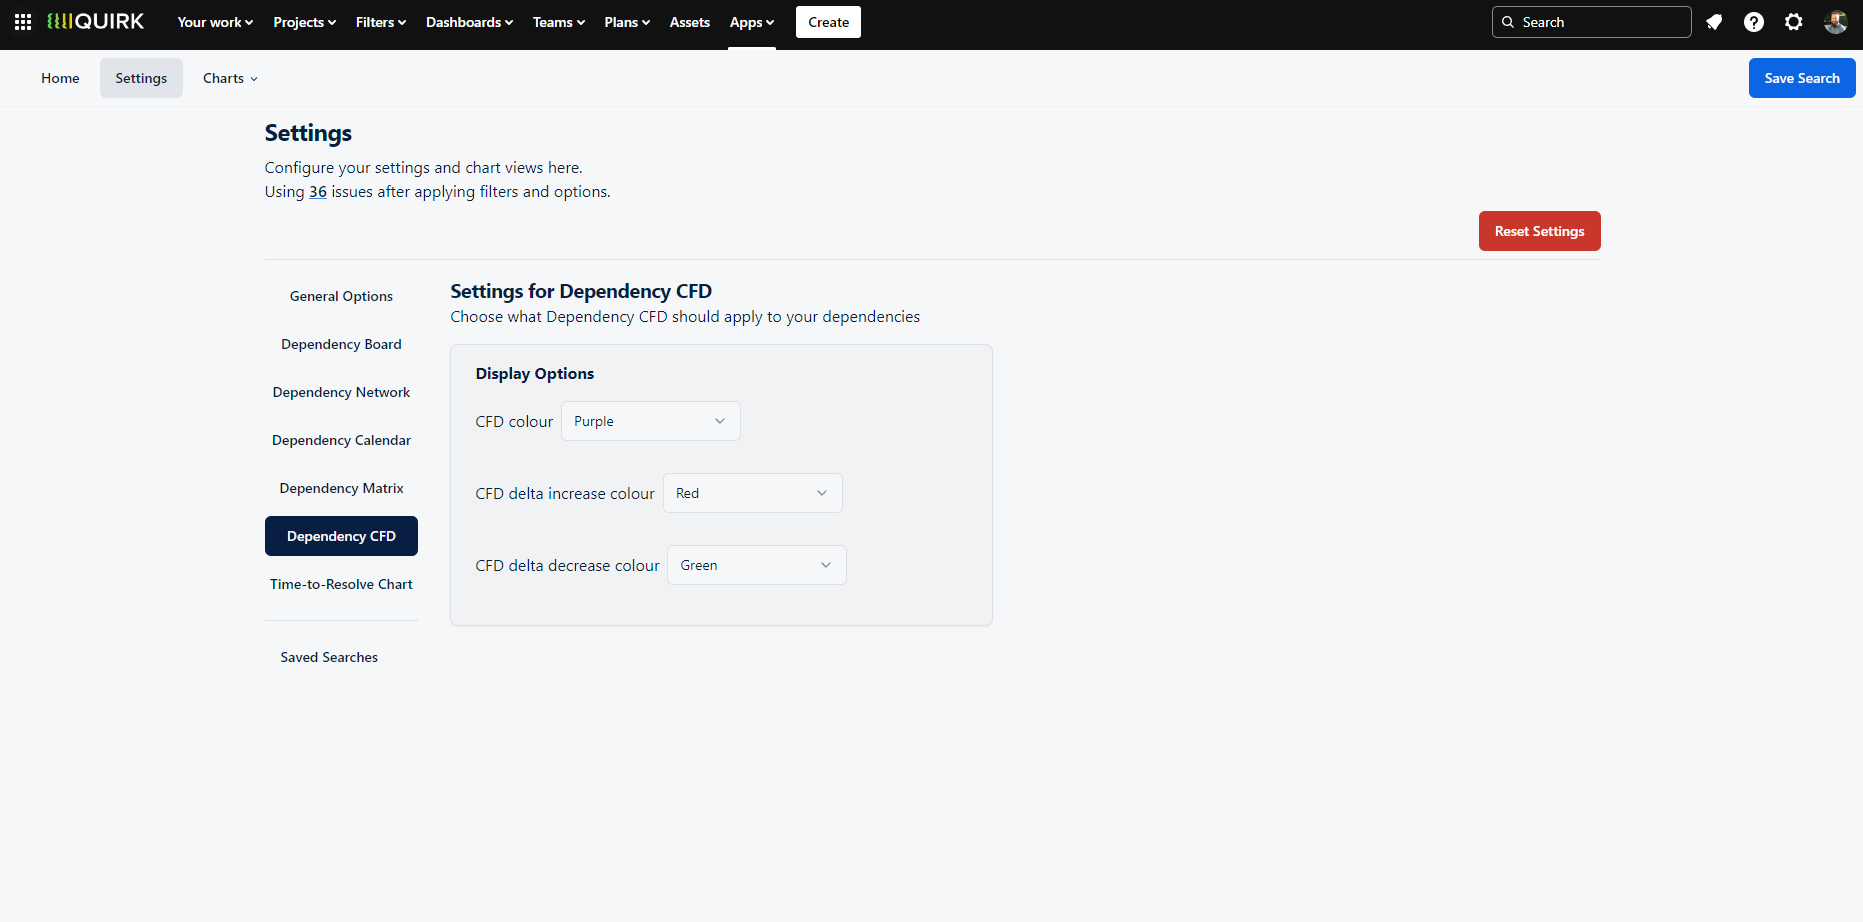
Customise the appearance of your Cumulative Flow Diagram by setting distinct colours for the main chart and delta variations.
‘Time to Resolve’ Chart Options
PDF Colour - Determines the colour of the Probability Density Function (PDF) view on the
Time to ResolvechartsCDF Colour - Determines the colour of the Cumulative Density Function (CDF) view on the
Time to Resolvecharts
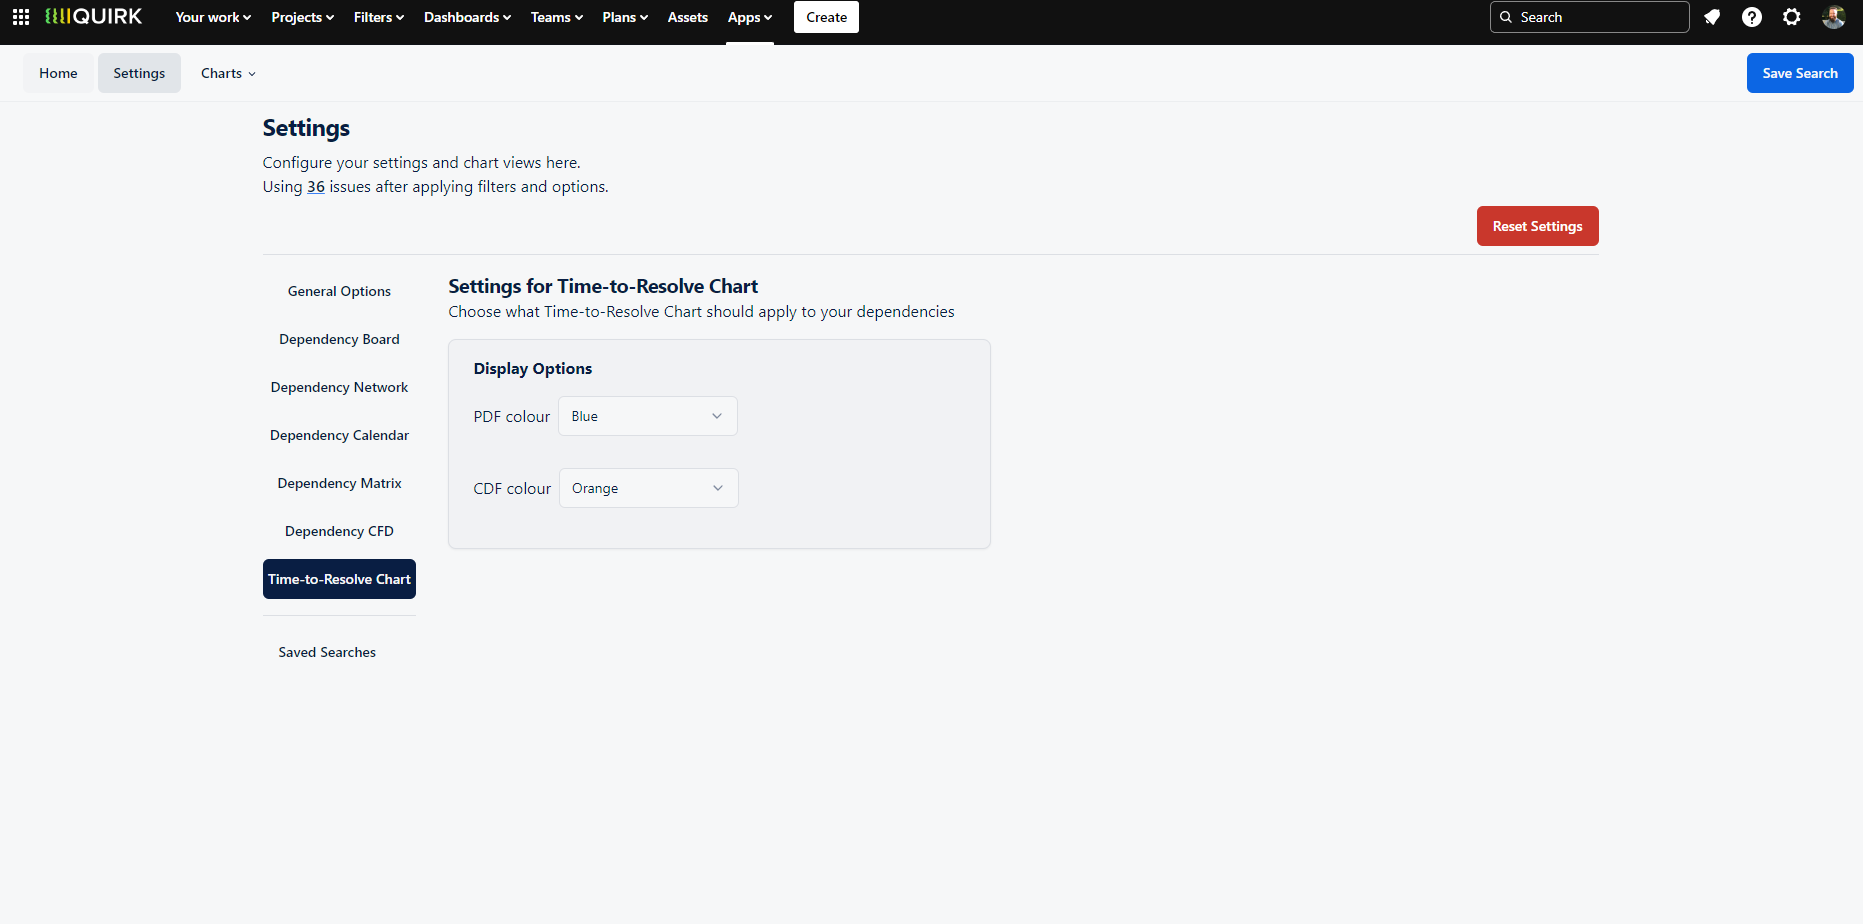
Control the visual appearance of your Time to Resolve analytics by setting distinct colours for both probability density and cumulative density function views.
Saved Searches
The Saved Searches section helps you manage your frequently used dependency queries. This page displays all your saved searches alongside their corresponding JQL queries, making it easy to review and organise your common dependency mapping workflows.
You can quickly rename any saved search by clicking its name, which turns it into an editable field. This lets you update search names to better reflect their purpose or match your team's evolving needs. To remove saved searches and return to the default settings, simply click the 'Reset Settings' button.
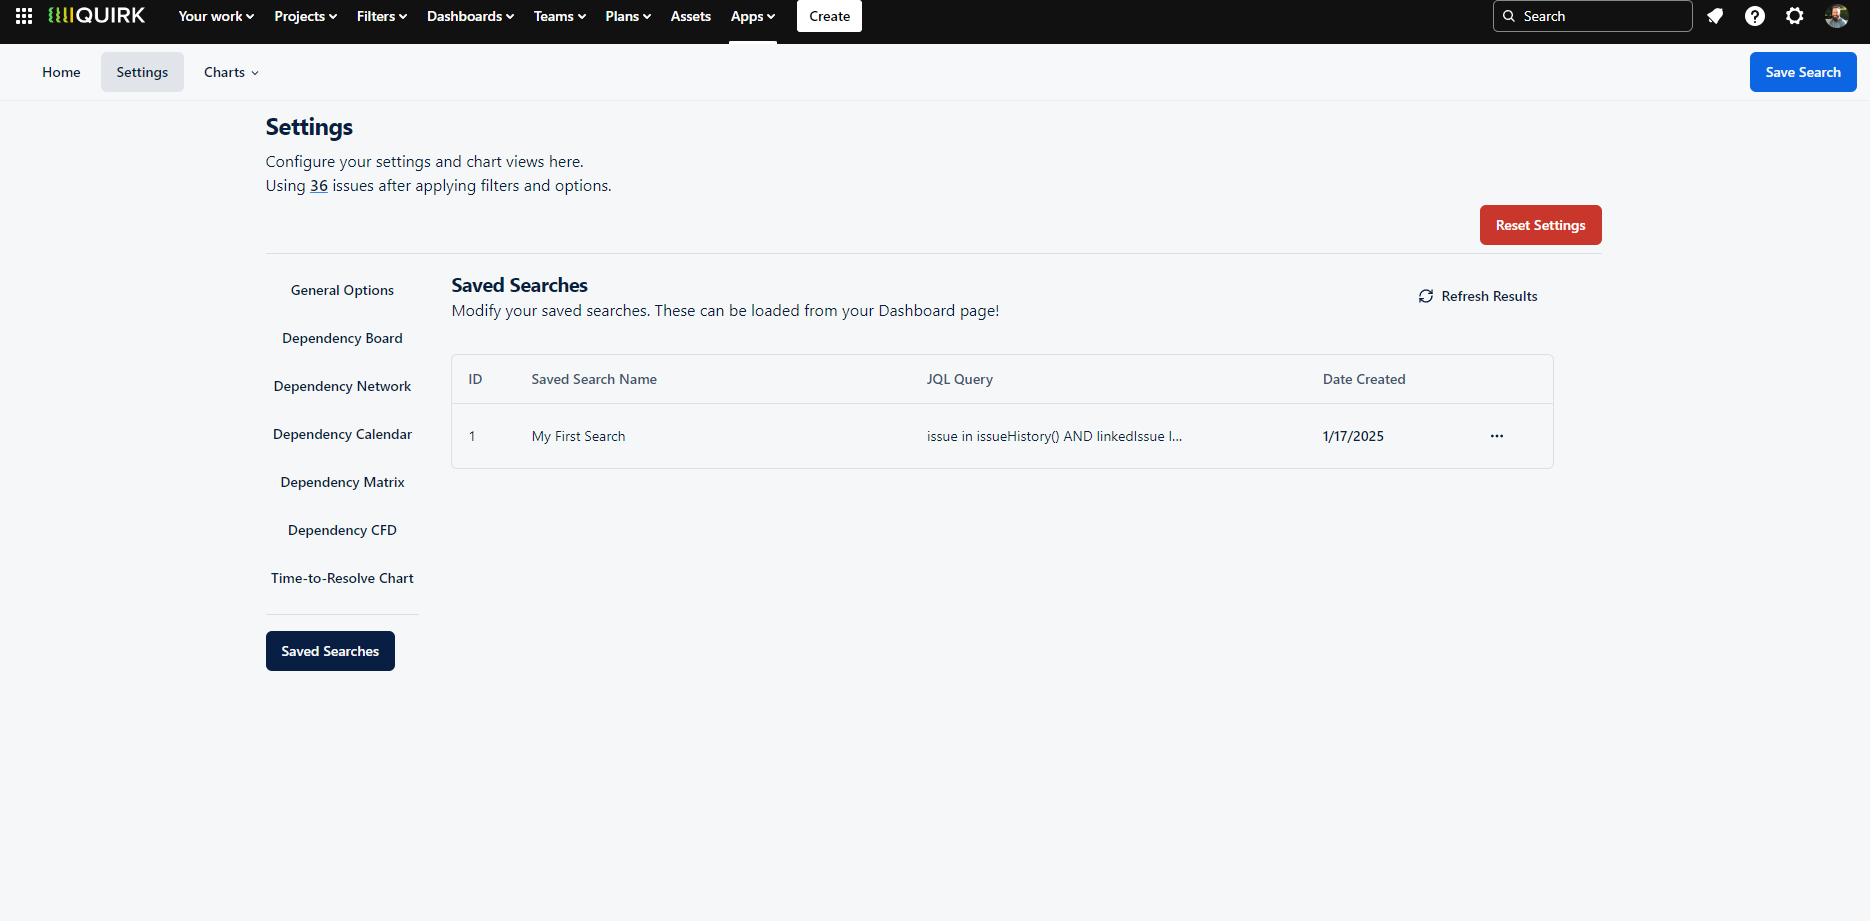
View and manage your saved dependency searches with easy options to rename or reset them.